Today, I want to talk about my favorite stock chart pattern. But first, I want to start on a bit of a tangent based on a couple of questions I’ve received from Cabot Growth Investor subscribers lately. The questions involve what I call “switching”—i.e., selling one stock you own and immediately putting the proceeds into another.
Obviously, if a stock has collapsed or tripped your loss limit, I’m all for selling. And if you see a great stock with an excellent combination of story, numbers and chart, I’m all for buying. But, in most cases, investors who want to switch out of a stock often do so for questionable reasons—because the stock has stalled out for a couple of weeks, because they read or heard something bad about the company or because they heard something great about another stock they want to buy.
Plus, there’s usually an element of what I call “super trader syndrome,” where people are eager to book a modest profit and try to catch the next horse out of the barn.
If you can consistently pull that off, more power to you. But in my experience, jumping in and out of stocks for small profits at the right time is more the exception than the rule. And making buy and sell decisions for superficial reasons also doesn’t lead to great success.
[text_ad]
Big picture, it’s important to remember that, as Jesse Livermore said, the big money is made in the big swing. For growth investors like me, that means getting in relatively early on a sustained upmove—and riding that upmove for many months. Oftentimes, these big winners will have periodic dead periods that wear investors out—right before the stock takes off again.
If you really are getting sick and tired of watching one of your stocks do nothing, tighten your stop. If the stock holds up, it might not be as weak as you think—and might be ready for another run.
Long story short, I’m not a huge fan of switching just for switching’s sake. If you do decide to jump around a bit, that’s fine, but just remember that the big money is in catching at least an intermediate-term (and hopefully a longer-term) upmove. Most of the rest is just icing on the cake.
My Favorite Stock Chart Pattern
As for the current market, it remains solid; the post-Labor Day selling looks normal so far, and while it could continue, I’ve seen very little abnormal action. I’m not complacent, and if the evidence changes, so will I. But at this point, after a heady August run in the market and many growth stocks, the recent dip looks like a digestion phase that will lead to higher prices.
The good news is that the ramp in the market in August (and even among certain names last week) came on big volume, which sets up nicely for my favorite chart pattern.
I call this stock chart pattern Volume Cluster Support (VCS), and it’s very simple to find—it occurs when a stock roars out of a consolidation or meaningful correction to new highs on multiple days of very big trading volume. After you spot a VCS, look for a reasonable pullback, tight consolidation or powerful breakout to buy. Simple!
Why does it work? Because institutions aren’t like you and me; they can’t buy their entire position with just a click of the mouse. Instead, big mutual and pension (and some hedge) funds usually need weeks or months to build their positions. So if they bought some shares as a stock rushed from 50 to 55 over a few days, they’re likely to add more shares as the stock dips back to 54 or 53.
Plus, since the stock just blasted off, this stock chart pattern lends itself to reasonable loss limits, so if the stock fails (usually because the market implodes or something else occurs out of the blue), your loss is contained. Often, a dip will lead to a quick snapback as big investors add to their positions.
Two Growth Stocks for Short-Term Gains
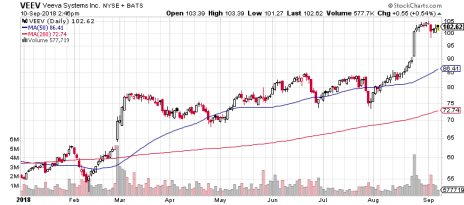
Let’s take a look at Veeva Systems (VEEV), which is positioned as the Salesforce.com (CRM) of the life sciences industry—it has the hands-down top position in customer relationship management offerings to that sector, and many newer products are beginning to land customers outside of life sciences. Growth has been steady and quick, with revenues generally rising in the mid-20% range and earnings rising faster than that.
The stock actually staged a volume cluster when it broke out of a nine-month base in February, but the choppy market since then didn’t let the stock make much progress; VEEV was sitting around 74 in early August, not much change from where it was in February.
But now VEEV is at it again. Check out the action starting in mid-August—as the stock lifted to new highs above 86, volume was above-average for three straight days. And then shares boomed on earnings and kept on rising to 105! All told, I count 10 straight up days, the final eight coming on above-average volume, including a few huge-volume days after earnings.
While VEEV has seen some post-earnings selling after Labor Day along with the Nasdaq and many growth stocks, it’s not retreating much, which makes sense. My guess is that even if the market does pull back further (which I think would be normal), VEEV should find support from big investors that are still filling out their positions.
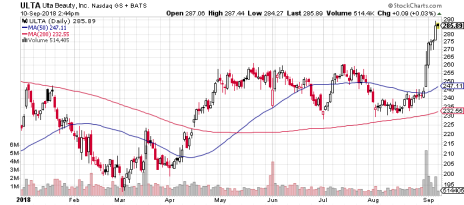
Another example of this stock chart pattern comes from a stock I mentioned in my column last week. Ulta Beauty (ULTA) has been growing nicely for a while, but the stock fell and stagnated from June of last year through August of this year as investor perception worsened.
Now, though, it appears ULTA may have turned the corner. Shares rallied a bit into May and then formed a nice, flat basing area (230 to 260) for the next few months. And then look what the stock did after earnings—not just one or two days but for five straight days (four on big volume). Especially considering that ULTA has been in the doghouse, my guess is that near-term dips will generally prove buyable given that big investors were clearly initiating and boosting positions.
Volume is a fascinating chart tool—most days it really doesn’t tell you much, but occasionally, it can spot major changes in supply and demand, cluing you into a new leader and good buy points. VEEV and ULTA are two of many examples I’m seeing in today’s market.
In Cabot Growth Investor I always look at volume and charts to identify the next market leaders. And our portfolio is on a roll (up 40% last year; up 16% so far this year) as the bull market rolls on.
[author_ad]
*This post has been updated from an original version.


