Before we dive into the top-performing commodity funds, I’d like to touch a little on the broader market. By now you’re surely aware that stocks have just entered bear market territory, traditionally defined as a decline of at least 20% in major indexes like the Nasdaq Composite or S&P 500 (SPX).
Because of this, it’s admittedly getting tougher to find anything worth buying, especially if you’re a momentum-oriented trader or investor. Just last week, on June 16, for instance, a single lonely stock was able to post a new 52-week high on the NYSE exchange—one of the worst one-day new high readings in memory!
Stocks making new 52-week lows, by contrast, are piling up by the day and have recently been well into the triple digits as selling pressure continues to mount. Needless to say, finding anything outperforming the major indexes is like trying to find a needle in a haystack.
But as the famous market commentator Jim Cramer reminds us, “There’s always a bull market out there somewhere.” The problem, though, is how to identify these hard-to-find pockets of strength in an otherwise weak market environment.
[text_ad]
One of the best ways I know of finding proverbial “gold in the mud” involves using a tool known as relative performance. The concept of relative performance as defined by Cabot founder Carlton Lutts is easy to understand. In Lutts’ own words:
“Relative performance (RP) is simply a measurement of how a stock is acting relative to the market as a whole. This can be measured mathematically, but we prefer a visual representation because we have found it easier to analyze. As they say, a picture is worth a thousand words.”
An RP line is basically the stock’s daily closing price divided by the daily closing price of the benchmark SPX or another major index. It shows how the stock is behaving compared to the broad market, and as such, is a powerful tool that will give you a considerable advantage over most investors.
Interpreting the signals given by the RP line are equally simple; when the line is moving higher, it shows a stock or ETF is outperforming the broad market. When it’s declining, it shows the stock/ETF is underperforming. A steady, level RP line tells you the stock is performing roughly the same as the market.
With that in mind, let’s turn our attention to five areas of relative strength within the commodity market (one of the few areas where a measure of forward momentum still exists). Here are the top-performing commodity funds as ranked by their relative performance against the SPX.
Top-Performing Commodity Funds #1: Teucrium Corn Fund (CORN)
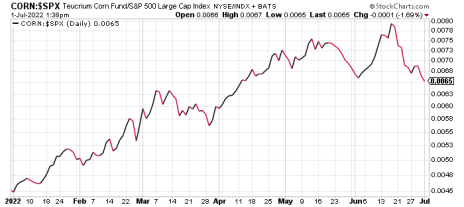
Poor planting conditions—including unseasonable heat—in the top-growing corn states in the U.S. have put upward pressure on corn futures prices in recent weeks. The situation is so bad in some areas of the Corn Belt that farmers are faced with the likelihood of having to replant their crop. Dry growing conditions are also a concern in number three top corn producer Brazil, as well as in parts of Europe. While this is bad news for growers, it has been good news for corn bulls and commodity funds with prices showing steady upward progress for most of this year. The RP line for the Teucrium Corn Fund (CORN) reflects this strength better than the corn price itself.
Top-Performing Commodity Funds #2: Teucrium Soybean Fund (SOYB)
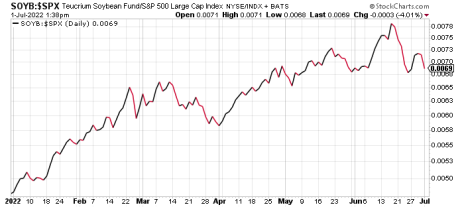
Soybean prices are up 30% in the year to date, driven by red-hot demand across the agricultural sector. Not only are soybeans used as food, they’re also used heavily to produce biofuels and are a critical ingredient in animal feeds. Moreover, top exporters Brazil and Argentina are expected to post significantly lower soybean crops this year compared to last year’s crop. In the U.S., meanwhile, planting delays due to a wet spring have put additional pressure on an already tight market situation. The RP line for the Teucrium Soybean Fund (SOYB) suggests there’s still enough momentum left to allow prices to remain buoyant—especially with inflation pressures expected to persist.
Top-Performing Commodity Funds #3: Teucrium Wheat Fund (WEAT)
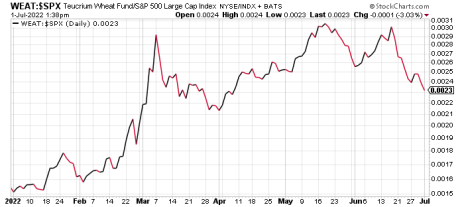
Global wheat prices have recently doubled, thanks in part to Russia’s invasion of Ukraine. Both countries are top wheat exporters, accounting for around 30% of the world’s traded wheat. The war has also resulted in a severe shortage of fertilizer used by wheat farmers around the world. One of the best ways of tracking wheat prices is through the Teucrium Wheat Fund (WEAT), which is the first pure play wheat exchange-traded product on Wall Street. Significantly, WEAT sports one of the strongest-looking RP lines of all actively traded commodity funds.
Top-Performing Commodity Funds #4: iShares Gold Trust (IAU)
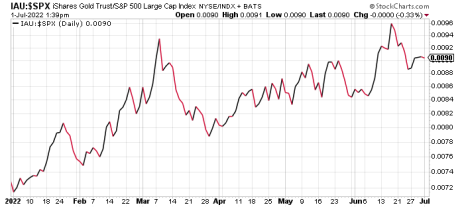
Gold tends to outperform when stocks are in a bear market, and while the gold-tracking iShares Gold Trust (IAU) ETF has definitely held its own in the last few weeks, it hasn’t exactly been setting Wall Street on fire. IAU hit a peak price of 39 in early March and then nosedived 12% before bottoming in mid-May above 34. IAU tested that low again in mid-June and again to start July. And while IAU still hasn’t managed to make a series of higher highs and lows (i.e. the beginnings of a new upward trend), the RP line for the gold ETF shows that strength is accelerating. Based on this relative performance, gold looks like an attractive safe haven should the SPX and Nasdaq remain mired in bear territory.
Top-Performing Commodity Funds #5: iShares Silver Trust (SLV)
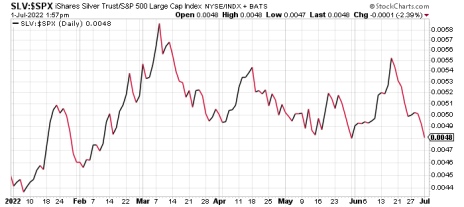
Like gold, silver tends to outperform when the broad stock market is bearish. Silver is known as “the poor man’s gold” due to its cheapness vis-à-vis gold on a per-ounce basis. The strongest gold bull markets occur when the silver price confirms gold’s price, or even better, leads it higher. The silver-tracking iShares Silver Trust (SLV) hasn’t really taken off yet, but its RP line has shown signs of strength. This valuable clue often signals that hedge funds and institutional traders (who often look at such signals) should become increasingly attracted to silver’s relative strength in the coming weeks and months.
Have you increased your commodity exposure in 2022? Why or why not? Let us know in the comments.
[author_ad]
