There’s a famous saying on Wall Street you’ve likely heard: “No one is going to ring a bell for you at a market bottom.”
This is another way of saying that most analysts, institutions, fund managers and other vested parties have little interest in letting the average investor know when it’s time to jump back in and take advantage of all the bargains to be had in a beaten-down market environment.
But you don’t always need to wait for a Wall Street expert to tell you when to buy after a big decline. In fact, there is a time-tested way of identifying when the market has likely put in a buyable low: ETF clues.
[text_ad]
Even better, these bottom ETF clues don’t involve sophisticated technical indicators or fancy algorithms. Instead, they’re readily available to any investor—regardless of skill or experience—and can be evaluated in a few minutes’ time.
The “bottom clues” I’m about to show you aren’t infallible (and shouldn’t be the only evidence you look at to determine when to invest), but they’ve proven useful in past market lows and should therefore be considered as part of your arsenal of market indicators. With that said, let’s take a look at them.
ETF Clue #1: Krane Shares CSI China Internet ETF (KWEB)
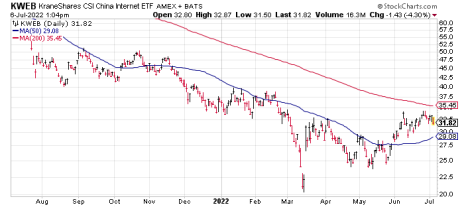
The KraneShares CSI China Internet ETF (KWEB) is arguably the most widely followed China-related ETF in the U.S. The trend of this ETF is important for investors for several reasons, and it also serves as a kind of proxy for the overall trajectory of China’s broad stock market. Indeed, KWEB reflects what’s happening in China’s all-important e-commerce sector and for that reason alone it’s worth following.
But what makes KWEB even more important for investors is its tendency to lead the major U.S. indexes, including the S&P 500 (due in part to the comprehensive economic cooperation between both countries). For instance, in early 2020 just prior to the pandemic-led crash, KWEB established a major top six weeks before the S&P 500 topped in a “heads-up” for what was to come for the U.S. market. Then, in mid-March of that year, KWEB hit its final crash low a full week before the S&P did, providing another leading signal that selling pressure had finally lifted.
More recently, KWEB posted a major top early last year and commenced a bear market well in advance of the market top and subsequent bear market in the S&P. But true to form, KWEB established a low well before the U.S. major indexes and appears to be on the verge of establishing a new short-term uptrend.
A decisive move above the 36 level would put KWEB back above its psychologically significant (and widely watched) 200-day moving average for the first time in over a year. More importantly, it would bode well for the China bulls but would also have bullish implications for the U.S. broad market.
ETF Clue #2: Grayscale Bitcoin Trust (GBTC)
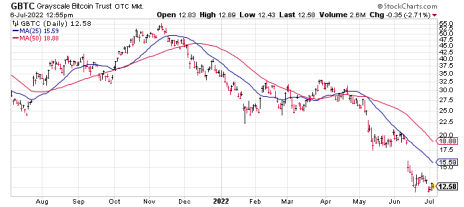
You might be wondering why bitcoin would have any significance for the U.S. stock market outlook. Well, as it turns out, there has been a fairly close correlation between bitcoin and stock prices in recent years.
The connection between bitcoin and stocks was, to my knowledge, first made by the well-known market technician Tom McClellan. He pointed out that whenever bitcoin prices rally, the S&P normally follows its lead within a week or two.
He made the case that bitcoin has become a leading indicator of sorts for the stock market (for some unknown reason). My explanation for this phenomenon is that cryptocurrencies like bitcoin have become a favorite speculative medium for the younger generation of traders, and when they feel like embracing risk, they turn first to the crypto market before turning to stocks.
If McClellan’s observation holds true once again, then the next sustained rally in bitcoin’s price should provide a leading signal for the equity market’s next tradable rally. My favorite proxy for tracking bitcoin prices is the Grayscale Bitcoin Trust (GBTC), which is shown here.
ETF Clue #3: iShares U.S. Broker-Dealers & Securities Exchanges ETF (IAI)
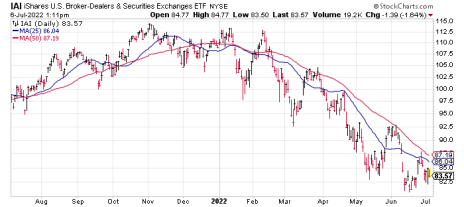
The fortunes of broker-dealers like Charles Schwab, LPL Financial and E-Trade tend to closely follow the tide of asset prices. But what you may not know is that the publicly traded stocks of broker-dealers have a remarkable history of not just following, but of predicting the short-term path of the broader market.
One way of tracking the trend of the broker-dealers is by following the iShares U.S. Broker-Dealers & Securities Exchanges ETF (IAI). In late 2021, the outlook for active trading and investing dwindled, which caused the leading broker-dealer stocks to turn lower well in advance of the S&P 500. IAI peaked last November, which provided a leading signal for traders that the broad market was about to become more turbulent.
True to form, the S&P entered a sustained decline that never let up over the next few months. And while the benchmark index did manage to briefly rise above its 50-day line in late March—a “head fake” rally which was quickly reversed—IAI never planted its flag above the 50-day line that month, hinting that the broad equity market trend was still lower.
The last three attempts at reversing its downward trend have failed, but if IAI can turn around and finally close above the 50-day line before the S&P does, it would have to be viewed as an encouraging sign for the near-term stock market outlook.
All told, the best signal for traders who want to “bottom fish” would be for all three of the above-mentioned ETFs to begin trending higher simultaneously. Given the predictive tendencies of these ETFs, such a signal would make a strong case for putting some capital back to work in the stock market.
[author_ad]


