Netflix (NFLX) just sank to a two-month low. Amazon (AMZN) just lost 84 points in three trading sessions. And Facebook (FB) set a record for most market cap lost in a single day. Yes, this earnings season has been a disaster for the FANG stocks thus far. But the broad market hasn’t suffered the way you’d expect.
As of this writing, the S&P 500 is trading comfortably above 2,800, well clear of the post-correction trading range it broke out from last month. The VIX volatility index, which is commonly known as the investor fear gauge, is at 13, well below its May and June peaks above 17.
In other words, despite the collective flop of Facebook, Amazon, Netflix and (to a lesser degree) Google (GOOG)—the so-called FANG stocks—investors don’t seem to be panicking. Stocks, particularly growth stocks, have pulled back sharply over the last week, but another full-fledged market correction does not seem imminent. Yet.
Mike Cintolo, our market expert, told subscribers of his Cabot Growth Investor advisory that a “good couple of days would make a world of difference.” Indeed, with earnings season still ongoing, and many big names left to report, a few strong reports could be all it takes to turn the tide.
[text_ad use_post='129627']
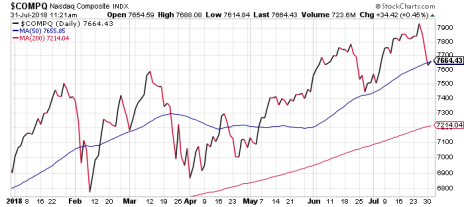
The FANG stocks certainly carry a lot of weight on Wall Street, and their recent drop-off was a big reason why the Nasdaq lost 300 points in just three trading sessions. But in this topsy-turvy year for the stock market, such precipitous drop-offs—particularly in growth stocks—are nothing new.
Here’s a backwards timeline of recent 300-point-plus declines in the Nasdaq:
June 20-27: The tech stock index fell 335 points in just five trading sessions.
March 12-April 2: The Nasdaq shed 718 in the second leg of the February-and-March market correction.
February 1-8: The Nasdaq plummeted 634 points in just six trading days as the first market correction of at least 10% in years commenced.
So, with four pullbacks of at least 300 points through the first seven months of the year—totaling roughly 2,000 points lost—you’d think this would be a disastrous year for stocks, right? Wrong! Despite all of those steep declines, the Nasdaq is up more than 9% year to date, more than double the return in the S&P 500 (+4.3%). In fact, the Nasdaq is still right on its 50-day line (see year-to-date chart below).
Thus, if you look at things from the 10,000-foot view—as Cabot Wealth Network’s chief investment strategist Tim Lutts frequently preaches—the general trend of the market is up. There have been more bumps along the way this year, and the last week or so has been especially painful for the FANG stocks and other growth leaders.
But right now, it’s little more than a flesh wound. Your portfolio may need a Band-Aid, but probably not an amputation.
[author_ad]


