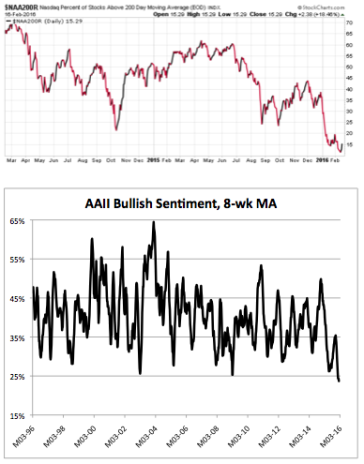
From their peaks last year through their lows of this year, the S&P 500 has fallen 15.2%, the Nasdaq Composite sank 19.5% and the S&P 600 SmallCap imploded 21.6%. And, as we’ve written before, those multi-month drops brought major extremes in breadth and sentiment. Two examples: The percent of Nasdaq stocks above their 200-day line dropped to 11.3%, while bullish sentiment among individual investors dropped to its lowest level in 23 years! (See charts.)
In other words, a lot of selling has been done in recent months, and many 65% All of that suggests the market might have hit a short-term 55% low, and could be starting a bottoming process. Here’s what that does and doesn’t mean. 45% It does mean that the odds favor some upside probing in the days and weeks ahead. For the market, we’ll be watching the levels of 1,950 on the S&P 500, 4,630 on the Nasdaq and 631 on the S&P 600—leaps above those areas in the days or weeks ahead would likely turn our 15% intermediate-term Cabot Tides bullish, which would prompt us to put a chunk of our sidelined cash to work.
The action also probably means that some stocks and sectors may have already hit their lows, and that new launching pads can start to be built both for leading growth stocks and for some off-the-bottom areas (see page 6). If this rally gains some steam, it should finally separate the proverbial wheat from the chaff—we’ll be looking for the tennis balls (stocks that surge back strongly on big volume) and crossing off the eggs (which don’t) from our watch list.
However, what all of this probably doesn’t mean is that the market will take off like a rocket from here, with the indexes and leading stocks ripping to new highs. The longer-term Cabot Trend Lines are clearly bearish, and the fact that so many stocks (and indexes) are below their 200-day lines implies there will be lots of resistance (selling by those who are looking to get out at breakeven) on the way up.
So what does this mean for you? If you’ve been following our advice, we’re not advising much action. We’re not playing for the short-term pops and drops, but for the next multi-month bull phase (where the big money is made). That said, if you have a ton of cash, the potential start of the bottoming process does provide the opportunity to jettison any laggards and add a stronger name, which is what we’re doing in the Model Portfolio tonight.
What To Do Now
We sold our remaining shares in Amazon (AMZN) last week as the stock plunged through long- term support, leaving us with 80% in cash. Tonight, we’re going to make a couple of moves— first, we’re selling half our shares in Ulta Beauty (ULTA), but we’re also adding a position in ?WHAT TO DO NOW PayPal (PYPL), which is a few months into a solid IPO base. That will leave our cash position at 74%.
[author_ad]

