With so much going on in the world as we enter a new year, where do stocks go from here? These 3 market indicators offer encouraging signs.
Happy New Year! I hope you all had a great holiday season and are rested and ready for whatever 2021 will bring.
So far, for the market, it’s been typically volatile both for the major indexes and individual stocks, and I’m not really surprised—the combination of the huge run in many stocks in November and December, the elevated sentiment, the election results and the fact that January is often tricky meant that some curveballs and hiccups (at least) were likely early this month.
In fact, while everyone is laser focused on the Georgia results, I’m really putting more stock in history: As I wrote in last week’s issue of my Cabot Growth Investor advisory, big up years for the Nasdaq (north of 30% returns, like we saw in 2020) almost always lead to some potholes—on average, the Nasdaq has started a 7% drawdown sometime in January after these big up years. Such a decline wouldn’t be shocking given the moonshot we saw during the past couple of months.
The good news is that these dips tend to be buyable—big up years generally lead to above-average returns for the following year as a whole (meaning 2021), and beyond that simple study, all of the primary evidence remains positive—the intermediate- and longer-term trends of the indexes are pointed up, and the same can be said of the vast majority of leading stocks (or all stocks). Thus, I’m bullish, but my eyes are peeled in case the selling early this year builds on itself.
[text_ad]
Still, in what could be a tricky time, I wanted to relay three market indicators I’m keeping a close eye on. Besides big down days in the market, they should provide some insight as to whether the market is changing character—or if the buyers are actually pushing their advantage.
Market Indicator #1: Cabot Aggression Index
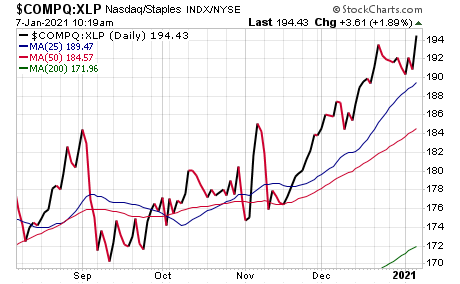
I’ve become more and more fond of our Aggression Index over time, as it gives a background view of whether big investors are putting money to work in growth stocks, or whether they’re hunting for safety. The Aggression Index is simply the relative performance (ratio) of the Nasdaq (growth) to the SPDR Consumer Staples Fund (XLP). Up means growth-y names are outperforming, down means that safe toilet paper, cigarette and toothpaste sellers are in favor.
So far, the Index is acting encouragingly—it actually went sideways from early July through mid-November before resuming its post-pandemic advance. And it’s still in a firm uptrend today despite some hiccups this week.
Technically, our Aggression Index is positive as long as the ratio is above its longer-term 40-week line (it’s a longer-term indicator), which isn’t close to being threatened. But in the near-term, I’ll be looking to see if the Index cracks its 25-day line or (more important) its 50-day line, which could happen if the Nasdaq sags or XLP really ramps up—which would be a sign that big investors are ringing the register on growth stocks.
Market Indicator #2: Stocks Hitting New Lows
One of the underpinnings of the latest upmove has been the tremendously positive breadth of the market, as cyclical stocks have kicked into gear—in fact, we received a couple of blastoff-type green lights soon after the November election, including the Three Day Thrust rule (three straight days of at least 1.5% gains in the S&P 500) and our New High Buy signals (basically the greatest level of new highs on the Nasdaq in at least two years), both of which portend good things down the road.
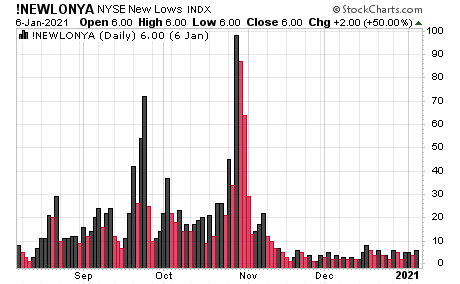
Not surprisingly, such strength from the broad market has kept the number of stocks hitting new lows at minuscule levels—new lows on the NYSE (our old Two-Second Indicator) have come in at 10 or less since early November, while the Nasdaq’s new lows did a similar disappearing act (24 or fewer during the same time).
Just as impressively, the number of new lows remained tiny even on Wednesday of this week, when there were some brief morning dislocations after the Georgia election.
Looking ahead, I’ll be watching to see how these figures react in relation to the overall market—if the indexes pull in but new lows remain very tame, it’s probably a sign that the selling pressures won’t persist. On the other end of the spectrum, if new lows really expand (especially if the indexes are falling), it would be a heads up that the selling pressures are broadening to more nooks and crannies of the market. So far, so good.
Market Indicator #3: Monitor Early-Stage and Recent Breakouts
This is a bit more nuanced, but it’s probably the most important one. Even if I don’t own many leaders (and because I run a concentrated portfolio, I won’t own them all), I like to keep track of many that have recently (past couple of months) gotten going from fresh launching pads—their action (good or bad) usually goes a long way toward telling you about the health of the underlying market. Here are a handful to keep an eye on, though I watch around a dozen or so.
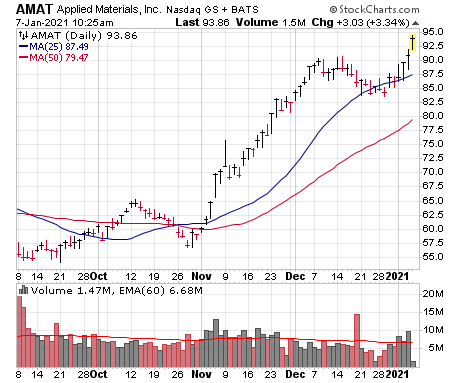
Applied Materials (AMAT) isn’t a go-go growth stock, but it’s one of the leaders in the chip equipment space, where many stocks (including AMAT) broke free from long-term bases in November. Right now, AMAT is on a good-looking, early-stage consolidation—it “should” be a decent buy in or around here (though it might futz around a bit more). Conversely, a decisive break below the 50-day line (now nearing 80) would be a bad sign.
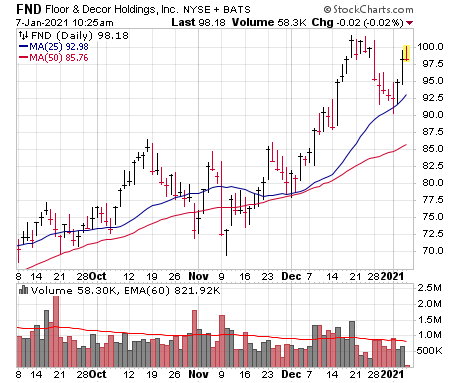
Floor & Décor (FND) is one of my favorite names in the housing/construction space, and like AMAT, it’s on a reasonable consolidation (pulled back for a few days and snapped higher since) after marching to new highs near 100. A move back into the mid/upper 80s would be a yellow flag, while obviously new highs would be bullish.
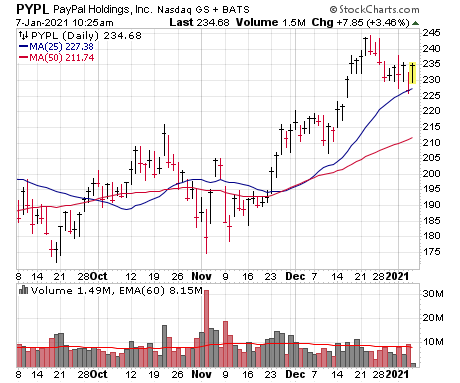
PayPal (PYPL) isn’t the most powerful leader, but this was a recent breakout (including a bullish volume cluster in November) and has held up well so far. A break back to 210 or so would be a borderline failure in the intermediate term.
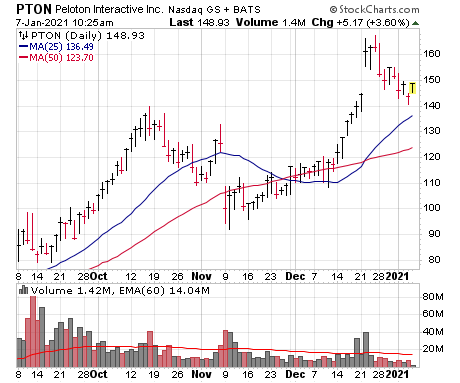
Peloton (PTON) is not early stage, of course, as the original breakout occurred around 37 last May. That said, it’s clearly one of the major leaders of this bull market and actually hit new price and RP highs recently before pulling back. Right here, it looks fine (possibly even buyable), but a drop into the low 120s (giving up the recent move) would be bearish.
Frankly, while I wouldn’t be jumping into four stocks right now, nibbling on a couple of these seems like a decent risk-reward bet. But my bigger point is, even if you never own a share of them, watching the action of these and some other leaders will be among you best market clues in the weeks ahead.
And if you want more ideas for what growth stocks to invest in over the coming months, you can subscribe to my Cabot Growth Investor advisory by clicking here.
[author_ad]
