I’m not really a subscriber to the maxim that a picture is worth a thousand words. Pictures and words are better at different things, and each medium can lie with equal facility. But Business Insider just sent out a Chart of the Day (sourced from Bloomberg) that makes a strong case for the picture side of the equation. And growth investors (like me) are fascinated.
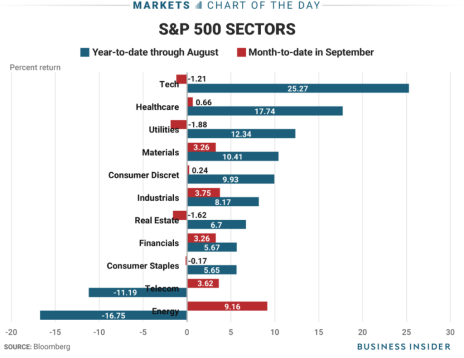
The chart in question shows the sectors of the S&P 500 and their performance from the beginning of 2017 through the end of August (the blue lines) and how they have fared for the month of September so far (the red lines). It’s a stunner.
There’s enough nutritious content in the chart to keep your brain busy for a few minutes, but the headline number is this: The top three S&P sectors (Tech, Healthcare and Utilities) through August were up an average of 18.6% and the bottom three (Consumer Staples, Telecom and Energy) were down an average of 7.4%. But since the beginning of September, the Tech/Healthcare/Utilities group is down an average of 0.8% and the Energy/Telecom/Consumer Staples group is up an average of 4.2%.
[text_ad use_post='129627']
No matter how long this correction lasts, that’s a stunningly symmetrical reversal.
But the practical implications for growth investors aren’t so clear. Let’s say you have a big position in the FANG stocks—Facebook (FB), Amazon (AMZN), Netflix (NFLX) and Alphabet (GOOG), which supplied the bulk of the advance in the red-hot Tech sector during the first eight months of the year.
Is this market correction a signal that you should now dump those stocks and go after the new leaders in the Energy sector?
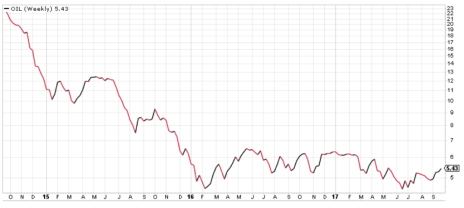
Well, there are certainly some interesting energy stocks out there, but I don’t think anyone is dancing a jig about oil prices. A weekly chart for iPath S&P GSCI Crude Oil Total Return (OIL), a popular ETF that tracks the price of crude, may show a bottom in June and July, but there’s precious little upside momentum to build on. The amount of supply that’s been suppressed by low prices is still there, and any gains in energy prices will have to chew through a ton of overhead to make any headway.
So while the picture presented by the sector reversal within the S&P 500 is fascinating, it’s probably best to stick to your guns with the stocks that have provided the firepower in your portfolio this year, at least for the most part. Sure, you can take some partial profits and dial back new buying until the staying power of this new market leadership can prove itself.
But the market is always working to get you to abandon your growth investing principles and take hasty action. Don’t let it. Growth investors: Stick to your plan and you’ll come out just fine in the end.
[author_ad]


