When I was a young pup back first getting interested in the market, I was obviously keen on learning how to find winning stocks; that’s probably the thing that attracts everyone at first. But, maybe because of my fondness of history (I was reading about some big market events of the past) or my contrary nature (this was during the late 1990s bubble), I was equally if not more attracted to market timing—the ability to avoid most of the growth stock selloffs or crashes, while being there for the bull moves, too, seemed like it would automatically put someone ahead of 80% of investors out there.
In fact, I remember interning at Prudential for a broker and leaving him research notes (in between cold calls) about how the market was in trouble—just as the market tumbled into that brief bear market.
Thus, after a couple of years of getting my feet wet at Cabot, I went to work fixing what had become, in part, a market timing system that was a bit outdated. (Who really needed market timing during the few years prior to 1999, when I started, as the market went straight up?)
It started with the invention of what we call the Cabot Tides, which is our intermediate-term trend model, it continued with a revamping of our Cabot Trend Lines (long-term trend indicator) a few years later and it’s kept improving with a couple of key secondary indicators and a focus on the action of leading growth stocks.
[text_ad]
Don’t get me wrong: No system is perfect, and neither am I, but staying on the right side of the major trends and avoiding disasters is vital to big, longer-term gains. Here’s the key point: Avoiding the worst of any implosion has nothing to do with predictions or being smarter than everyone else. Instead, it’s all about staying in gear with the market, taking it day by day … and ignoring everything else.
Indeed, I keep it very simple: To me, market timing can be boiled down to (a) what are the market’s underlying trends, (b) is the broad market healthy and (c) are growth stocks acting properly or not. Obviously, there’s a little judgment and know-how involved, but when it comes to the market, that’s all I pay attention to.
And this is exactly how, in my second year of running Cabot Growth Investor, we were able to sidestep the vast majority of the 2008 crash. Our Cabot Trend Lines turned bearish in January of that year, which got us heavily into cash early on. There was a modest springtime rally that we played lightly (not much progress), but when the rally failed in the summer we had all of our measures pointing down: Intermediate-term trend, long-term trend, broad market and the action of leading stocks—in fact, we sold the rest of our stake in a huge winner (First Solar) and were 90% in cash … and then a week or two later, Lehman went under and the rest is history.
Which leads me to 2022—and how we’ve again been able to sidestep most of this year’s bear phase, especially in growth stocks. Again, we had no predictions concerning the Fed, about the European war, about China’s zero-Covid policies, about the midterm election or anything like that. Instead, we just followed along with the time-tested strategy.
Starting late last year, our indicators started to show signs that something was amiss—the initial break off the Nasdaq’s mid-November 2021 top turned the intermediate-term trend negative, and while that was mostly back to neutral-ish by year-end, few growth stocks were looking good—in fact, many of the leading growth titles showed very iffy action back then, with a name like Shopify (SHOP) collapsing 28% in just four weeks off the top and nosing below its long-term moving averages.
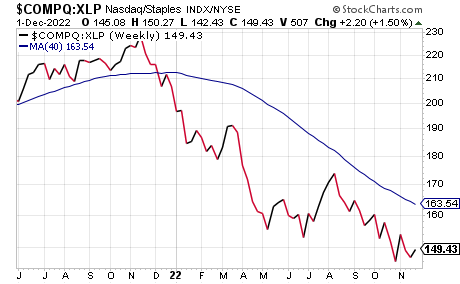
Our Aggression Index—which measures the relative strength of growth (Nasdaq) vs. defensive stocks (consumer staples)—turned negative then, too. Notice how the Index dipped below its long-term 40-week moving average last December and hasn’t looked back.
Because of that, we came into the year 45% in cash … and, as it turns out, that’s been our lowest level of cash all year.
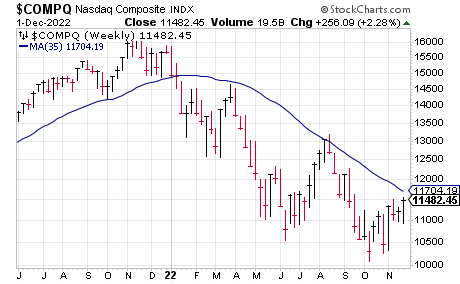
Our Cabot Tides flipped back to negative in early January, and more importantly, our long-term Cabot Trend Lines turned bearish near the end of that month—while the Trend Lines obviously flash later given their long-term nature (we use 35-week moving averages on the S&P 500 and Nasdaq, along with a couple of tools to prevent whipsaws), it’s our most reliable indicator. The prior signal to that was June 2020 (after the pandemic crash) and, throughout history, the Trend Lines will be positive for 80% to 90% of the time during bull markets and negative 75%-80% of the time during bear markets. And the Trend Lines are still clearly bearish today!
Since then, we’ve made the occasional foray on the buy side when the market has made a run of it—our Cabot Tides turned positive for a time in March/April, in the summer, and again during the past couple of weeks. However, (a) the long-term trend hasn’t budged, and (b) individual growth stocks have never kicked into gear, with constant selling on strength and with growth underperforming defensive stocks.
All in all, we’ve averaged around two-thirds in cash the whole year and have actually been higher than that recently as growth stocks continue to hit air pockets.
Of course, the real benefit to avoiding the downside is that you have more to invest when the bulls return—and they will! The big money in the market is in the big swing, owning new, fresh growth stocks (the next Shopify’s and Twilio’s if you will) early in a fresh bull market, and riding them for many months if not a couple of years.
That’s my main focus now, and when my indicators (especially the Cabot Trend Lines and Aggression Index) give green lights and when individual stocks begin to break out, you can bet we’ll be piling in.
To learn which stocks Cabot Growth Investor subscribers will be investing in when the next bull market arrives, subscribe today!
[author_ad]


