Today, I want to tell you about how Square stock became a big winner for regular readers of my Cabot Top Ten Trader advisory. But I want to start by talking about how to interpret market signals.
In my nearly 20 years at Cabot, I’ve had the good fortune of meeting a bunch of top-notch investors from a variety of fields, including many in person at various conferences. One of them is Walter Deemer, a now-retired student of the market and technical analyst who retired after a five-decade career.
Walter has just come out with an “idea” book called When the Time Comes to Buy, You Won’t Want To, a brief collection of 64 quotes and sayings that he’s harvested over the years. It’s a very quick read and earned a place on my overcrowded bookshelf in the office.
[text_ad use_post='129623']
One quote in particular I think applies to the current environment:
“The Market Gets the Most Oversold at the Bottom and the Most Overbought at the Beginning of an Advance.”
The reason I love this quote/fact is that it’s so contrary to how people think, and it’s confusing, too! First, when everyone is throwing stocks out the window, bears are everywhere and the economic news is bad—that’s bullish. But when the market rebounds and goes straight up for weeks after that—that’s also bullish. What?
It’s true. Investors get tripped up because market extremes mean different things at different times, and extremes on the upside have to be interpreted just as much as extremes on the downside.
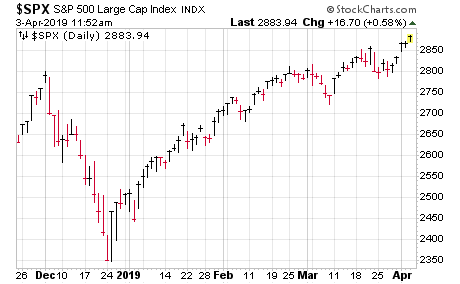
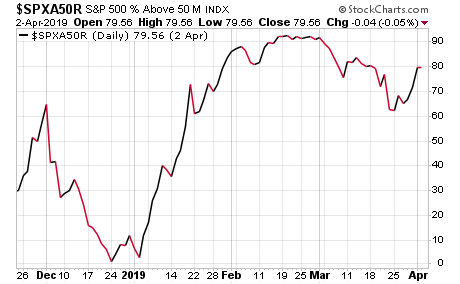
As the quote says, major market bottoms almost always go hand-in-hand with huge “oversold” readings that are seen once every few years (if not more). That’s exactly what we saw in late December 2018, which I’ve written about before. One example: Just six stocks in the entire S&P 500 were above their 50-day line on Christmas Eve!
But then what happened? The market went straight up, so much so that it triggered some rare “overbought” readings, especially those concerning market breadth—in the same chart, you can see the percent of S&P 500 stocks above their 50-day line ripped to as high as 92% in February! The logical conclusion? Especially with the major indexes still below longer-term resistance and with so much bad economic news coming out, the hyper-overbought readings were a sign to sell!
But that isn’t how it works. The saying above plays into the various “blastoff indicators” that I follow—when the market gets crazy overbought, it actually portends higher prices down the road, which is exactly what’s happened in recent months.
If you’re looking for a reason, it’s because fear “crystalizes” at some point on the downside, with many throwing in the towel (or being forced to sell; margin calls for big funds, etc.), which etches a major low. On the flip side, extremely overbought readings tend to represent times when you see a sudden change in investor perception for the better—and that improved perception takes time to filter through to the majority of investors, creating sustained buying.
Anyway, this is one of many fruitful market truisms in that book. And it’s one to store away for future use.
The Square Stock Example
Another thing that trips up investors is that the same type of action—say, a huge wave of buying in an individual stock—can mean totally different things depending on where a stock is in its overall run. To be clear, no one can know for sure exactly how much room a stock has left on the upside, but a little chart work can give you an idea if it’s in the second, third or fourth inning, or in the seventh, eighth or ninth.
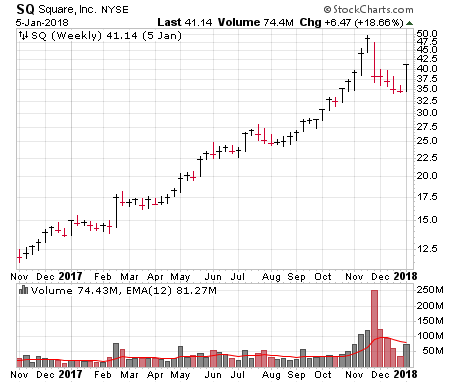
Take a look at Square (SQ), which was one of the market’s leading glamour stocks of the 2017-2018 advance. The stock broke out of its big post-IPO base in February 2017 and, after a few weeks of resting, surged as high as 28 in July of that year—up more than three-fold from its mid-2016 low and nearly double the breakout level.
There were no guarantees, of course, but given that (a) the stock was just over four months up from its original breakout and (b) the market emerged from a two-year dead period just seven months before, things looked promising. The odds favored the market’s bull move continuing, and SQ, which had shown leadership qualities, surging higher. Sure enough, the stock doubled again four months later!
The stock continued to act well in 2018 with some normal wobbles, though by this time I would say the stock was more a hold than a buy—it could keep chugging (which it did), but the odds of a longer-lasting top and correction were growing.
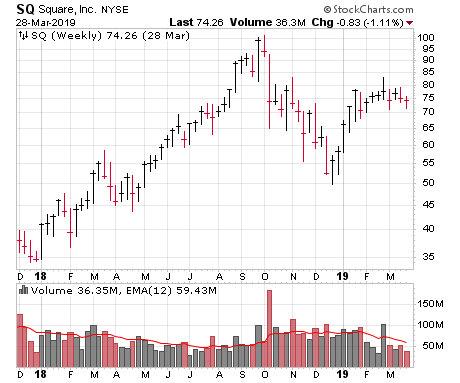
Fast forward to the summer and fall of last year, and SQ had another big run—after a short shakeout after earnings in July, the stock ramped from around 70 to 100 in just seven weeks! That strength looked similar to what was seen back in 2017, but there was a big difference when interpreting that action: Square stock was a year further into its advance, and thus, was far more heavily owned and obvious to the crowd.
The result was that SQ was near a top. Even after its market-induced plunge in the fourth quarter, the stock really hasn’t kicked into gear yet. (To be clear, I’m not bearish on Square stock at all—and in fact the stock is tightening up here. Just saying that, at the very least, it’s not the leader it once was.)
So what’s the meaning of this tale? Simply that, when you see overwhelming strength early in an advance (for the market or for a specific stock), it’s usually more of a sign of a kickoff to a sustained move. (This assumes, of course, the market is healthy, the stock has a great story and growth numbers, etc.) On the other hand, once a stock has been running for nine, 12 or 15 months, a rapid acceleration higher is often an opportunity to let some shares go.
That’s why, when looking for new buys, we’re leaning toward stocks that have had big runs recently (past couple of months), but overall, seem to be early in their moves.
The Next Square Stock?
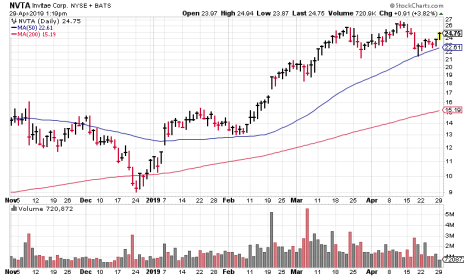
One example: Invitae (NVTA), a company with a great story—it’s on the way to bringing genetic testing to the masses with a comprehensive testing platform that has driven costs per test way down (down 24% last year alone, and 67% over the past three years). Revenue growth has been fantastic, and after initially showing strength last year, the stock has shot ahead on increased trading volume this year.
That said, this action comes after three years of post-IPO doldrums, so I’m looking at NVTA’s strong, persistent upmove more as the start of a bigger upmove, not the end of it. Whether it’s on the current mini-pause or a deeper dip toward the 50-day line, I think NVTA could provide a nice opportunity.
And if you want to know what other momentum stocks I like right now, you can subscribe to my Cabot Top Ten Trader advisory by clicking here. Every week, Cabot Top Ten Trader recommends 10 of the hottest growth stocks on the market, and Square stock was one of the many big winners I’ve recommended over the years.
To learn what momentum stocks I’m recommending this week, click here.
[author_ad]

