Investing in an economically and geopolitically turbulent and politically charged environment is challenging, but using the right tools can drastically increase your odds of successfully navigating the stock market’s troubled waters. Here I’ll explain how using the new 52-week highs and lows will help you instantly locate the weakest segments of the market, while also helping you isolate areas of unusual strength.
When it comes to equity market investing, one of the most important concepts for investors to understand is that of relative strength. Relative strength is basically a gauge of how well a particular stock, industry or sector is performing compared with the broad market as measured by a benchmark average (such as the S&P 500 Index). By focusing on publicly traded shares that are in a relative strength position versus the S&P, you can be reasonably assured of improving your investment batting average over time.
While there are exceptions to the relative strength rule, the rule is fairly simple: Whenever a stock or stock group is conspicuously outperforming the S&P 500 for an extended period, it’s assumed that the “smart money” (e.g. institutional investors, hedge funds and/or corporate insiders) are actively involved in the stock(s) in question and have likely been accumulating shares. And it’s usually a good idea to follow the footsteps of these informed participants so that whatever stocks they own, you also want to own.
[text_ad]
What the 52-Week Highs Tell Us
There are many different methods for finding relative strength in the equity market, but one of the simplest and most effective ways is to monitor the daily number of stocks making new 52-week highs and lows. Both major U.S. exchanges publish these figures each day and they can be found on any number of websites for free (my favorite is the The Wall Street Journal’s list, which you can find here).
Whenever major averages like the S&P 500 are in an extended upward trend, many traders use the new 52-week highs for the NYSE and Nasdaq exchanges to quickly locate the stocks which stand the best chance of continuing to trend even higher. This is a momentum strategy, and although it’s not without pitfalls, it can be quite effective as long as bull market conditions prevail. That’s because stocks which consistently make new 52-week highs typically don’t face as much overhead supply or “chart resistance” (i.e. previous price peaks, which often serve as reversal areas for stocks). After all, it’s much easier for institutions to push stocks higher when there are no previous obstacles in the way.
CNBC’s Jim Cramer has observed, “As a voting machine, you cannot [beat] the new 52-week highs, and they do not get there for no reason.”
New 52-week highs have also been likened to baseball players who boast stellar batting averages (the players you want to bet on). Just as ball players on a hitting streak tend to continue outperforming, so, too, do the stocks which consistently make new highs—that is, as long as bullish broad market conditions prevail. And a bullish environment is usually characterized by new 52-week highs outnumbering new 52-week lows by at least a 3-to-1 ratio (the higher the better) on a daily basis.
What the 52-Week Lows Tell Us
Which leads us to the other important aspect of the new highs and lows, namely how they can be used to quickly isolate areas of weakness. Whenever a general market uptrend shows signs of losing steam, one of the first places you should consult to see where most of the weakness is concentrated is the list of NYSE and Nasdaq stocks making new 52-week lows.
The total number of listed stocks making new 52-week lows, while easy to gauge, contains a wealth of information in itself. The new lows tell us: 1.) if there’s an unusual degree of selling pressure within the market; and 2.) where exactly that selling pressure is located. Years ago, a study was made here at Cabot covering all stock market environments going back to 1962. That study found that:
“As long as the number of daily new lows did not exceed 40, the market was sound and in no danger of falling significantly. And remarkably, this specific threshold of 40 new lows remained the same over the entire 50 years we studied.”
This observation forms the basis of the Cabot Two Second Indicator, which is a daily determination of whether there are fewer than 40 stocks making new 52-week lows on the NYSE and the Nasdaq. If there are more than 40 new lows each day covering a period of several consecutive days, you can be reasonably certain that there’s an abnormal degree of selling pressure somewhere in the market. And to isolate where exactly that selling pressure is coming from, all you have to do is pay attention to the stocks touching new lows; specifically, what sector or industry those stocks trade in.
(As an aside, this especially holds true during times in which the major averages are still in an uptrend, yet the new 52-week lows are increasing. It can almost always be assumed in such cases that the “smart money” is using the market’s surface strength to disguise their distribution, or selling, activities.)
To illustrate the Two Second Indicator in action, let’s briefly examine the stock market’s latest internal profile.
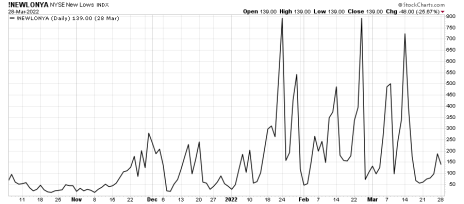
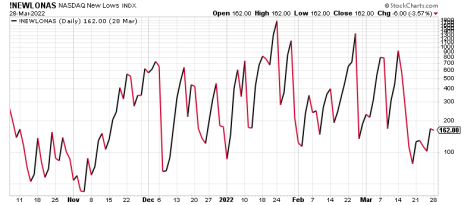
In recent days, there has been a notable decrease in the number of stocks making new 52-week lows on both major exchanges, particularly on the Nasdaq. There are currently 66 NYSE stocks trading at 52-week lows, and just 56 Nasdaq stocks. Those are still high numbers, mind you, but WAY down from this year’s highs of 672 for the NYSE and 1,501 for the Nasdaq, which both of them hit on January 24.
Here’s what the NYSE and Nasdaq 52-weeks lows look like on a chart:
While the highs (99 on the NYSE, 84 on the Nasdaq) do outnumber the lows by a wide margin right now, it’s nowhere near the 3-to-1 ratio mentioned early; it’s not even at 2-to-1. So, we’re not in bullish territory yet, despite the massive reduction in 52-week lows in recent weeks.
Once the new lows shrink to below 40 for several consecutive days, while new highs steadily increase (preferably to a 3-to-1 or greater ratio versus new lows), you can reasonably infer that sellers have been cleared out of the market and that the bulls are back in control of the dominant intermediate-term trend. But as long as there are 40 or more stocks making new 52-week lows each day, it’s generally a good idea to play it safe and avoid plunging back in with both hands.
As our growth investing expert Mike Cintolo has pointed out, “One of the big secrets to investing is to avoid making huge mistakes, and if you stay in gear with the trends and the action of the leaders, you’re guaranteed never to miss out on a major upmove or to stay bullish during a prolonged drop—and that fact alone puts you ahead of 80% of investors.”
Using the 52-week highs and lows to zero in on strength and avoid weakness will help you do just that.
If you want the best performing growth stocks right now, I highly recommend subscribing to our Cabot Top Ten Trader advisory, where every week Chief Analyst Mike Cintolo provides you with 10 of the market’s strongest growth stocks from both a technical and a fundamental perspective.
To learn more, click here.
Do you monitor 52-week highs and lows? What other market indicators do you use? Tell us about them in the comments below.
[author_ad]
*This post has been updated from an original version, published in 2020.


