The following three stock market indicators will help you uncover some of the market’s best growth stocks simply by looking at a chart.
Every few months, I like to write about what I call Chart School, and that’s the topic of my column today. I’ll show you a few things that I’m seeing in the market and relate them to stock market indicators that you can use in your investing going forward—think of them as timely tricks of the trade.
Today I focus on chart-based stock market indicators in three areas: earnings gaps, volume clue support and relative performance (RP). Let’s get right to it.
Stock Market Indicator #1: Earnings Gaps
I’ve already written 100 times about how positive earnings reactions are usually a bullish sign for the intermediate-term, while gaps lower on earnings tend to depress a stock in the weeks ahead. But you still need context by considering (a) how big the rally was, (b) how large the volume was and (c) where the stock is on its chart following the gap.
[text_ad]
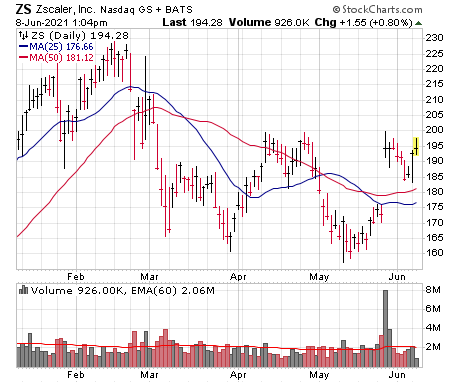
Let’s look at Zscaler (ZS), a fast-growing provider of cybersecurity—one of a handful of “new age” firms in the sector that has a product built from the ground up for the new digital, mobile work environment.
First, ZEN gapped up 12.4% on earnings, which is solid—not the biggest one of all time, but generally I like to see at least a 10% move (maybe slightly less if it’s a mega-cap name) to catch my attention.
Second, volume was great as well—not only was the tally more than quadruple the average (I like to see at least triple, but the higher the better), but notice how it dwarfed the selling volume seen during ZS’s decline with growth stocks in March and again in April/May.
The third item (where the stock is on its chart following the gap), though, is less than ideal—in this case, ZS gapped up from close to the lows of its base and moved right up into a prior resistance area near 200.
None of the above means that ZS is a black sheep—and in fact, the gap is a good sign that the overall correction may be over. But this wouldn’t be what I would consider a buyable gap—it’s a plus, but you still need to see continued constructive action before concluding the buyers are back in control.
Stock Market Indicator #2: Volume Clue Support
I find trading volume provides some of the best chart-based stock indicators. What I want to touch on today is a “follow-up” pattern if you missed buying a big earnings gap or breakout.
I call it “volume clue support,” which is easy to understand: If a stock has many days in a row on the upside of huge volume, then it’s likely to find support on dips during the next couple of weeks. The reason? Big investors that were buying during the prior surge probably didn’t finish building their positions. So they nibble on dips in the days ahead.
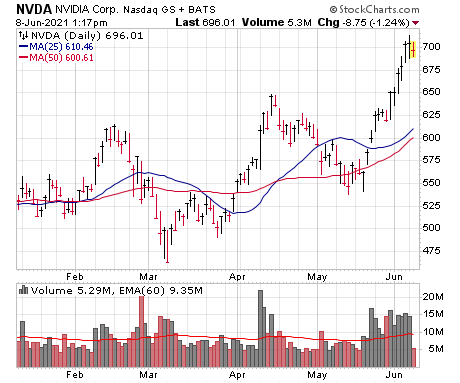
The clearest example of volume clues I’ve seen in growth land in a while comes from Nvidia (NVDA), which was the Top Pick in my Cabot Top Ten Trader advisory back on June 1.
You can see that since mid-May, there’s been a ridiculous string of giant-volume buying as the stock has soared to new highs. Assuming the Nasdaq doesn’t start yet another 10% down leg, my guess is any near-term weakness will prove buyable.
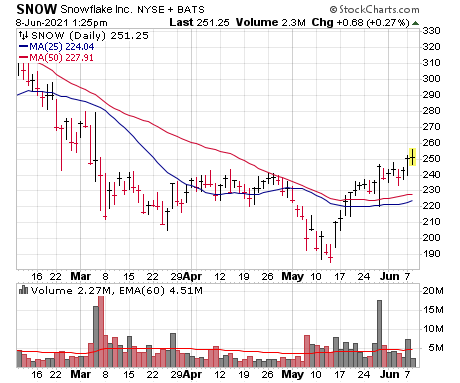
Another example, and this one from a stock coming off a low, is Snowflake (SNOW), which has a very unique Big Data offering that’s producing some jaw-dropping numbers. The valuation is huge, and SNOW was more than cut in half from the start of the year through April. But look at the action since the low—repeated big-volume up days, then a huge-volume reversal higher on earnings, and some follow-on buying in early June. Even the stock has hit three-month highs. My guess is dips will probably find support, at least in the near term.
Stock Market Indicator #3: Relative Performance
A relative performance line tells (in graphic form) how a stock is performing relative to the S&P 500. I always check a stock’s relative performance line (RP line for short), which tells me whether the stock is outperforming the market, underperforming it or acting about the same—effectively telling you whether it’s showing real power or just getting pulled up by the market.
Personally, I like to see an RP line currently at new highs (or pulling back for a couple of weeks after recently hitting a peak).
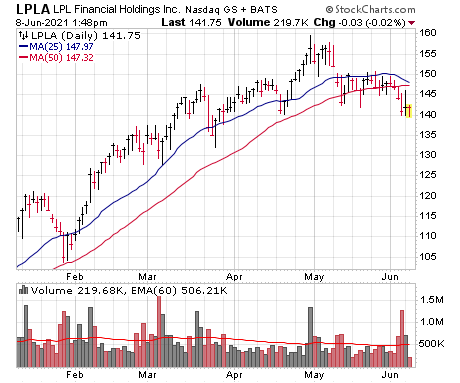
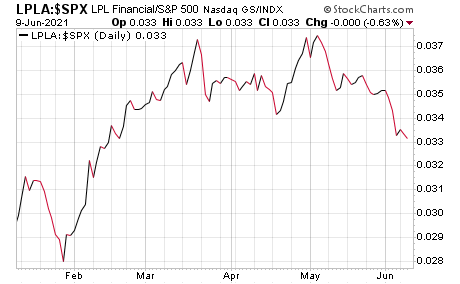
For instance, take a gander at LPL Financial (LPLA), which is the largest independent broker-dealer in the U.S. and is one of the leading advisory firms as well—a straightforward bull market stock. As with most financial stocks, LPLA kited higher nicely for many months and looked as strong as ever at the end of April before the sellers finally showed up.
Was there a clue that LPLA was about to run out of steam? Yes, it was the RP line, which is shown below—note how, despite the upmove in the stock to new highs, the RP line effectively double topped at that point, a subtle clue that LPLA was leaking momentum.
To be clear, not all RP double tops like this will precede a breakdown, but usually it’s a good idea to take note of them and keep an eye out for trouble.
My Favorite Growth Stock Right Now
For my stock idea, I looked for one that incorporated all three of the indicators above. But unfortunately, no dice these days—growth stocks are still in a slow recovery mode from a very tough three-plus-month correction, so there aren’t any quality gap-and-go stocks with lots of volume clues and beautiful RP peaks.
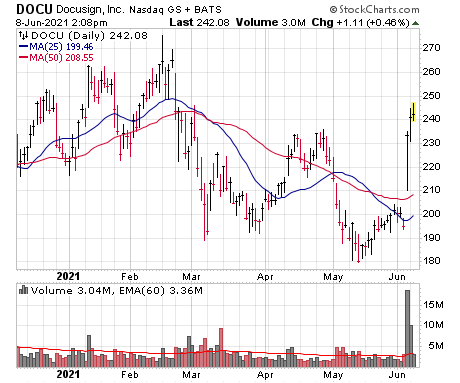
But here’s an oldie-but-goodie name that’s off to a good start. It’s DocuSign (DOCU), the leader in e-signatures and one that continues to show amazing growth, with revenues up 53%, 57% and 58% the past three quarters (accelerating) while earnings are exploding (up north of 200% the past two quarters) and analysts see great growth ahead (earnings up 81% this year and another 30% next; both estimates are likely conservative).
And after a tough, very long correction (the top was actually back last September, before the start of this chart), DOCU may be changing character—there was a big earnings gap last week (up 20% on six times average volume!) and some nice follow-through since … possibly the start of a volume cluster. Moreover, the RP line (not shown, but take my word for it) is beginning to confirm the recent move, edging over its April high just like the stock itself.
Don’t get me wrong, DOCU still has work to do, but the evidence suggests perception may have turned the corner. I’ll be watching for a proper setup (maybe another couple of weeks of tight action, etc.) followed by a powerful attack of the old highs.
[author_ad]
*This post has been updated from an original version published in 2017.

