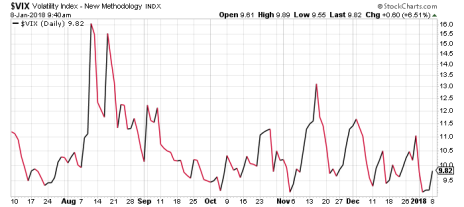
Market volatility has been incredibly muted of late, at times almost nonexistent. In fact, the VIX, a stock volatility index that is commonly known as the investor “fear gauge,” just posted its lowest back-to-back closes in the history of the index. And a low VIX makes for a strong market.
In stock market terms, volatility is the measure of how greatly stock prices vary over a period of time. And the VIX, properly known as the Chicago Board of Options (CBOE) Volatility Index, measures market expectations of near-term volatility based on option prices among S&P 500 stocks.
First, let me show what the low VIX looks like on a chart. Here is a six-month chart of the volatility index:
How does that compare to previous years? Here are a few numbers about stock volatility I’ve gathered from various sources, with a major assist from our options trading expert Jacob Mintz.
50: That’s the number of days the VIX closed below 10 last year. Prior to 2017, the stock volatility index had closed below 10 a combined nine days since 1990! That’s an average of once every three years, versus 50 times in 2017 alone.
9.14: The closing number for the VIX on November 3, a new all-time low. It nearly matched that number last Wednesday, finishing at 9.15. The index has been up every day since, but still sits below 10 as of this writing.
8.84: The intraday low the VIX hit on July 26, also an all-time low.
13.13: That’s the highest number the VIX has reached since August. For comparison sake, the VIX never dipped below 14 from mid-2007 through the end of 2012.
16%: That’s how much the VIX tumbled last week alone! As a result, stocks got off to a fast start in 2018, with all three major U.S. indexes reaching new all-time highs. The Nasdaq led the way, with a 3.95% gain.
That’s a lot of very specific numbers, but they essentially all say the same thing: market volatility is really low. The question is: what does it mean? Is the low VIX merely the calm before an inevitable storm, as some analysts (mostly bears) will have you believe? Or is it telling us that the market waters are warm—jump right in?!
As always, the answer lies somewhere in between. Jacob, who is an expert on all things market volatility and the VIX, says he, for one, isn’t sweating the historically low numbers—yet.
“The lack of volatility and low VIX does not concern me as a trader,” Jacob says. “However, when I read articles from mainstream media outlets highlighting a Target (TGT) store employee who is opening a hedge fund based on shorting the VIX strategy, my radar certainly goes up.
“At some point buying a new hedge will absolutely be the right move with the VIX at these depressed levels. However, I have seen nothing in option order flow to push me in that direction.”
[author_ad]


