After a stellar performance in 2020 and a so-so 2021, gold has been one of this year’s biggest disappointments. After a promising rally in the first quarter, gold fell 17% from its March peak of $2,050 an ounce to $1,700 just three weeks ago. But the decline looks like it may have finally ended in a classic “washout” with small investors running away while market-moving, big gold players have lately jumped in as buyers—potentially good news from a contrarian perspective.
What’s more, the picture painted by recent CBOT Commitments of Traders statistics suggest heavy commercial buying interest across virtually every major metal category (including silver, copper and steel).
A recent Wall Street Journal article by Hardika Singh observed that investors in recent months have been worried that the latest inflation data could push the Fed toward “more aggressive” interest rate increases to cool down inflation. This worry has had the effect of pushing U.S. government bond yields higher while weighing on gold (which, WSJ reminds us, doesn’t pay a dividend).
[text_ad]
The WSJ article voiced the rhetorical question many investors have undoubtedly asked themselves throughout the past year, namely: “Why am I holding gold and paying to hold it when it really hasn’t performed as an inflation hedge?” Individuals aren’t the only ones asking this question apparently, as hedge funds and other speculators have recently turned bearish, according to WSJ, “for the first time in more than three years.”
A Contrarian Case and Big Gold Investors
This mass exodus away from gold and gold-related investments in recent weeks has occurred just as the “smart money” commercial hedgers have drastically reduced their short positions in gold and silver. Recent data also suggest they’ve backed off their bullish outlook on the dollar (at least in the short term). Collectively, this evidence paints a potentially bullish picture for gold in the coming weeks—especially if the dollar begins to weaken.
On that score, there is mounting evidence that the slowing U.S. economy will prompt the Fed to slow the pace of its rate increases. Indeed, at its last FOMC meeting, the Fed encouraged this outlook by increasing the fed funds rate by 75 basis points instead of the originally intended 100 basis points.
Fed Chairman Jerome Powell also indicated the Fed’s decision on whether or not to slow the pace of rate hikes will depend on economic data in the coming weeks and months. He further suggested that “it intuitively makes sense that slowing the pace of rate increases would be appropriate,” should the economy continue to soften. This would presumably put downward pressure on Treasury yields and the dollar, in turn allowing gold an opportunity to recover.
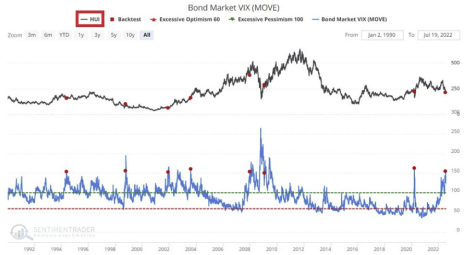
Turning our attention to gold stocks, the actively traded miners are in the best technical position in years to establish a major bottom. That’s the conclusion of a recent deep dive into the historical data by statistics guru Jay Kaeppel. In a recent edition of his Kaeppel’s Corner newsletter, he observed that there is a distinctive inverse correlation between the NYSE Arca Gold Bugs Index (HUI) and the so-called “VIX Index” for bonds, which measures the implied volatility of options on Treasury bond futures.
Since 1990, whenever the bond market VIX rose above a level of 150, it coincided in each case with an intermediate-term bottom for the HUI. This is illustrated in the following chart that compares the HUI (top line) with the bond VIX (bottom indicator).
According to Kaeppel’s research, whenever this correlation occurred (and it just did in late July), the average aggregate return (or “win rate”) for gold stocks two months and six months after the signal was made was an astounding 86% across both time frames. (The only exception was the 1998 signal, which happened to occur against a backdrop of crashing commodities prices exacerbated by the LTCM hedge fund fiasco.)
A final consideration—as we’ve been talking about in the last few weeks—is that seasonal factors are in gold’s favor starting around early August and extending into early October. While seasonal considerations will always be secondary to the more paramount technical and fundamental factors governing gold’s short-term trend, it’s nonetheless encouraging that if the big gold investors are indeed making a run on gold right now, they’ll have a positive seasonal tailwind at their back for the next two months.
All told, the evidence is starting to mount that this could finally be gold’s proverbial hour in the spotlight. Yes, the metal has consistently disappointed us since March, but other metals are showing signs of life as well. We’ll take a closer look at these strengthening metals in the coming days.
How important are contrarian signals to you when you consider increasing your gold exposure?
[author_ad]


