There’s no point in sugarcoating it: the last two-plus months have been rough for investors. The bleeding started in October, resurfaced in November, and just when it looked like the worst of the selling might be over, stocks are threatening to hit new lows again as we start the second full week of December. As of this writing, the S&P 500 is down 10.5% since its late-September peak; the Nasdaq has fallen 14% from its late-August apex; and the Dow is down 9.7%. That’s bad. But believe it or not, there have been worse market corrections this decade.
Three Bad Market Corrections
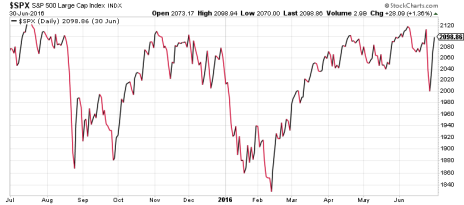
From July 2015 to February 2016, the S&P 500 tumbled 12.3%. The market seemingly bottomed in late August of 2015, recovering nearly all its late-summer losses by early November. But after holding firm through year end, an even deeper plunge arrived when the calendar flipped to 2016, and the new bottom didn’t come until the second week of February (see chart below).
[text_ad use_post='129623']
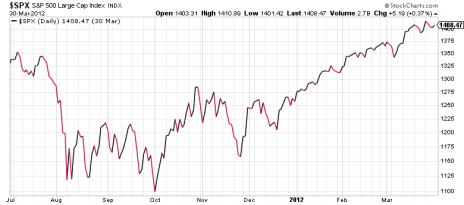
The second half of 2011 was another rough patch for the market.
Again, the slide began in July, and while it didn’t last as long as the 2015-16 slow-bleed, the losses were more pronounced; the S&P lost 16.5% of its value in one month! After a false start in October, stocks retested support in November (sound familiar?), before getting going for good just before Christmas (see chart below).
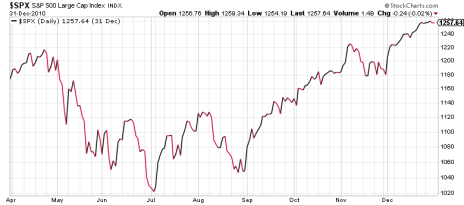
A similar market crash occurred in the spring of 2010. From the third week of April through the end of June, the S&P shed about 16%. Stocks didn’t really get going again until late August (chart below).
All three of those market corrections lasted at least four months, with an average peak-to-trough low point of 15%, at least among large-cap stocks. So far (key words, to be sure), the current market correction has lasted about two and a half months, with slimmer losses than the three I just mentioned.
What Now?
Does that mean we’re in for another month and a half of this misery? Perhaps. And it’s entirely possible that the market hasn’t found a bottom yet, just as it didn’t in the painfully long 2015-16 retreat.
But here’s one other thing those three market corrections have in common, as you can see from the charts: stocks recovered to hit new highs within a year every time. This too shall pass. And the best thing you can do is wait out the storm by going heavily to cash, selling your losing stocks (there’s a tax benefit if you do it before year’s end!), and reduce buying to a minimum.
As our market expert Mike Cintolo wrote to his Cabot Top Ten Trader advisory subscribers last Friday, “The action makes it clear that (a) sellers are still lurking and (b) the environment is extremely news-driven. Combined with the still-negative longer-term trend (which turned negative in mid/late October), it means it’s best to remain in a mostly defensive stance.”
When the clouds do finally part and it’s time to get aggressive again, we’ll be the first to let you know. To receive regular market-related updates from any of our Cabot analysts, click here.
[author_ad]


