Analysis Paralysis
Trend Channels Can Help You Time Your Entries Better
Two Ways to Play the Current Trend Channels
---
The sheer preponderance of technical analysis tools can generate enough information to overwhelm an investor. An old colleague of mine habitually perused so many different indicators before making a trade that he would get analysis paralysis. He looked at too much information and wanted everything to line up perfectly. If it didn’t, he would not make the trade. Sometimes, he had so much information that he just froze.
Contrarily, I try to rely on a few indicators that I’m comfortable with and that produce good results for me. One particular pattern that I use are trend channels. Trend channels illustrate the top and bottom of the trend and can help you determine good entry and exit points. They are not the most complicated patterns, but I have found them to be very useful, especially for longer term investing.
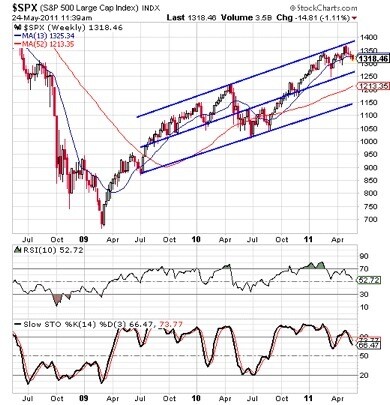
Here is an example of a good trend channel on the S&P 500.
The lower rail is formed by the lows in July 2009 and July and August 2010. The upper rail is parallel to the lower rail and is defined by the highs in April 2010, February 2011 and April 2011. This particular trend channel has a midway line as well, though not all of them do. In this case, the midway line is formed by the minor pullbacks in February and November 2010.
Trend channels are not an exact science. If a stock declines below its lower rail for a day or two, it isn’t a reason to panic and sell. On the flip side, a stock or an index moving above the upper rail for a few days isn’t necessarily a reason to jump ship and sell everything either. The rails provide guidelines for you to perhaps lighten up on a long position when it hits the upper rail or maybe add to a position if it hits the lower rail.
I recently observed an analyst on CNBC talking about trend channels with regard to the currency market. The analyst explained an effective way to use them. When an investment vehicle is in a trend channel, it isn’t necessarily a sign to sell when it is at or near the top of the channel. However, if you are not invested in that vehicle, you don’t want to buy when it is near the top rail of the channel. That is how I feel about the S&P right now.
The S&P isn’t the only index or exchange-traded fund (ETF) that’s currently in a trend channel, either. I’m watching several right now, waiting for a better entry price on funds that are in an upwardly sloped trend channel so that I can add them to my IRA account. A few of the ones I am watching are the SPDR Gold Trust (GLD), the Materials Select Sector SPDR (XLB) and the Powershares QQQ Trust (QQQ). All of these ETFs have been trending higher for several years now. The problem is that they have been lingering near the upper rail, providing few low-risk opportunities.
--- Advertisement ---
Cabot’s Best Stock Across All Sectors
If you want to diversify your portfolio and profit from using several different investing philosophies to pick winning stocks, Cabot Stock of the Month is right for you. Not only is it priced so low that every investor can afford it and you’ll easily recover the cost from your very first profitable investment. Get started today!
---
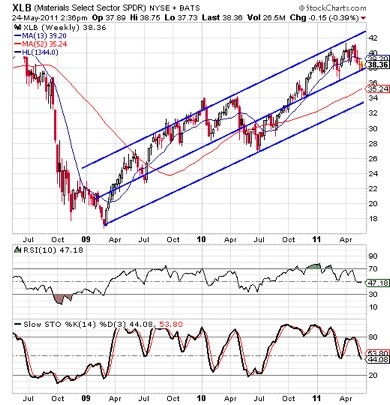
The one ETF I’m watching the most closely is the Materials Select Sector SPDR (XLB). I believe the demand for basic materials like steel and copper will continue to increase as countries like China and India grow at a faster pace than the more developed countries.
As with the chart of the S&P, the ETF marks a clearly defined channel with a midway line. In recent weeks, the ETF has pulled back from the upper rail and is now sitting at the midway line. You could choose to wait and see if the ETF drops down to the lower rail before adding the XLB to your portfolio, or you could add it now. I intend to play it another way.
I intend to buy 100 shares in my IRA over the next few days here at the midway point of the channel, and then sell a September 35 Put on the XLB as well. If the XLB drops down below the $35 level and the stock gets put to me, I’m OK with that because that would make my entry price somewhere around $34.25 based on what the option is selling for right now. This would give me the full allocation of 200 shares that I seek.
If the ETF rises from here, I have some exposure. If it drops down to the lower rail, the put gets exercised and I will own the 200 shares I want. In the meantime I have also collected the premium on the September 35 Put.
So don’t get overwhelmed with all the information that’s available for analyzing a potential investment. Using trend channels can help you better time your entry points, but the most important way to avoid analysis paralysis is to just keep things simple and stick to your system.
Sincerely,
Rick Pendergraft
Editor of Cabot Options Trader
Editor’s Note: Leverage your investments to make money in all markets! Cabot Options Trader Editor Rick Pendergraft uses the market’s volatility to bring his subscribers huge profit-making opportunities. Just check out these gains from the last few months: a 155% gain on an Altera (ALTR) Call in a mere six days ... a 77% gain on an Icici Bank (IBN) Put in only five days ... and a 128% gain on a Maxim Integrated Products (MXIM) Call in 12 days! Join today!

