With the dog days of summer upon us, I thought today would be a good time to take not just one, but two or three steps back and look at the market’s big picture. And when I say big, I mean very big—often dubbed the market’s secular trend, it depicts how the market has been acting over the last decade or two. I’ll also tell you why I think we’re in the early stages of a new secular bull market. More on that in a bit.
Believe it or not, in spite of the wildly different economic environments that have existed during the past century, the stock market has displayed a very similar, repeating pattern over a secular time frame, generally rallying for 10 to 20 years, and then moving sideways for 10 to 20 years.
Why? It really has to do with cycles of investor perception. Obviously, during the 2000s, we saw earnings generally increase and (even more so) interest rates plunge, which should have made stocks more attractive. But this came after the peak in perception in 2000, when investors believed the Internet revolution would prevent all recessions going forward!
Anyway, like I wrote above, it turns out the market has these repeating patterns over the very, very long term. 1929-1949 saw no net progress for the market. 1949 to 1966 then saw stocks have a giant run! 1966-1982 was another flat period (with many deep bear markets interspersed). Then came the 1982-2000 bull market move that ended with the Internet bubble.
[text_ad use_post='129623']
And then we had the secular bear market from March 2000 through April 2013—13 years of no progress that included two of the biggest bear markets (don’t forget the 2000-2003 bear market that caused the Nasdaq to fall 78%!) of the past century.
And Now, A Secular Bull Market
But that’s in the past—we’re now about five years into a secular bull market, and if history is any guide, we’re probably in the third or fourth inning of this mega upmove. Said another way, the odds strongly favor this uptrend lasting at least another few years, if not longer.
However, as I talked about at last week’s Cabot Wealth Summit, I’m not simply saying this because of the market’s longer-term chart pattern. When you dig into the data, you see that almost all of it supports the view that we’re in the early- to mid-stages of the secular advance.
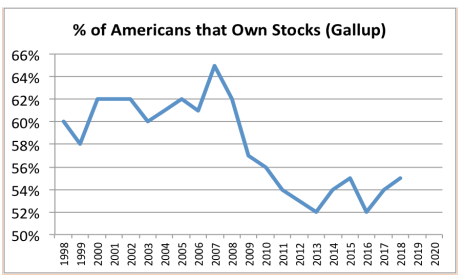
Below are two charts from my market outlook presentation last week that support that view. The first is one of my favorites: It shows the number of people in the U.S. who (via an annual poll by Gallup) say they own stocks either directly or indirectly through mutual funds, 401(k)s and the like.
Even after the Internet bubble popped, 60% to 65% of the country owned stocks, but the financial crisis changed all that—the figure not only dropped after the wipeout but kept dropping right to 2013, when the current secular bull market began. And despite the gains in recent years, not many people have come back onboard. Clearly, we’re not seeing the get-in-the-door-now mentality that occurs near massive market peaks.
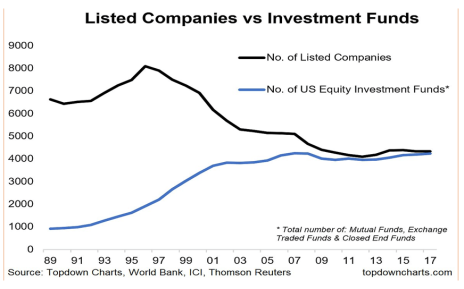
The next chart shows something similar, but from Wall Street’s point of view—it’s the number of listed companies (the black line in the chart) in the U.S. (I’m not as interested in the number of funds.) The number of public firms peaked in 1995 but was still around 7,000 near the bubble peak of 2000. Today, we’re in the mid-4,000s.
Sure, some of this is probably regulatory in nature (remember Sarbanes-Oxley?), but are you telling me that Wall Street has all of sudden decided to not sell whatever shares it can to the public to make all the money it can? Of course not! Instead, this is a sign that the demand for new offerings is low and/or valuations remain reasonable (M&A activity takes firms off the exchange).
There are many other things I could relay, but the fact is this: Whether you’re looking at charts, sentiment or even fundamentals, the odds favor that the current secular bull market likely has many years to run. That certainly doesn’t preclude a sharp market correction or even a mini-bear market at some point, but it does mean that equities are likely to be much higher when looking a few years down the road.
Whether it’s an advisory that goes after home runs like Cabot Growth Investor or Cabot Top Ten Trader, or an advisory that takes advantage of cheap growth stocks like Cabot Undervalued Stocks Advisor, we have plenty of offerings that can help you make as much money as possible from the ongoing bull market—for years to come. To learn how to subscribe to any of our 12 investment advisories, click here.
One Promising Early-Stage Stock
Moving back to the here and now, the current market environment is still challenging—the title of my most recent Cabot Growth Investor issue was “Positive, not Powerful”, and that basically sums up my thoughts.
In other words, is the trend up and is there more good than bad out there? Yes. But are big investors engaging in a persistent buying spree in leading stocks? No. Hence the chop and news-driven action.
At this point, I’m looking for early-stage opportunities (as always) that have shown some excellent trading volume clues during the past month. And, preferably, I’d like to see a bit of tightness, too, a sign that the supply of stock has been wrung out.
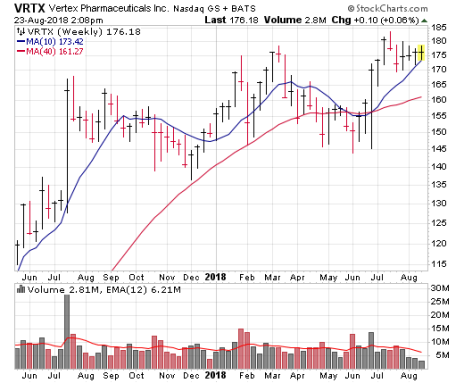
One idea that, admittedly, hasn’t yet truly broken out on the upside (but has a beautiful consolidation) is Vertex Pharmaceuticals (VRTX), a leading provider of cystic fibrosis treatments that popped up on my radar at the end of June when a competitor’s cystic fibrosis treatment fell flat. Shares soared on massive volume, and pushed higher for another few weeks.
Since then VRTX has done … not much of anything. But what I’m seeing is that volume has really dried up; the last two weeks have seen super-tight price spreads and volume about half the weekly average. Throw in bullish fundamentals (analysts see earnings up 91% this year and 25% next, both of which could prove conservative) and I think the stock could be ready to go—a powerful move above 184 or so would be intriguing, while a drop back into the high 160s would tell you sellers are still lurking.
[author_ad]


