Earnings season chart patterns can be powerful tools for identifying new stock market darlings, here are two to be on the lookout for.
As we head into another earnings season I wanted to mention two chart patterns you can be looking for during earnings season—two unusual shows of power that frequently lead to sustained (even long-term) advances.
Earnings Season Chart Pattern #1: The 10x Rule
The first is what we call the 10x Rule: Find a stock gapping up meaningfully (usually at least 10%, though it could be a bit less depending on the nature of the stock) on at least 10 times its average volume. While earnings season always launches a ton of gaps up and down, finding a liquid stock (no penny stocks, thank you) that moves that much on 10 times average volume is relatively rare.
[text_ad]
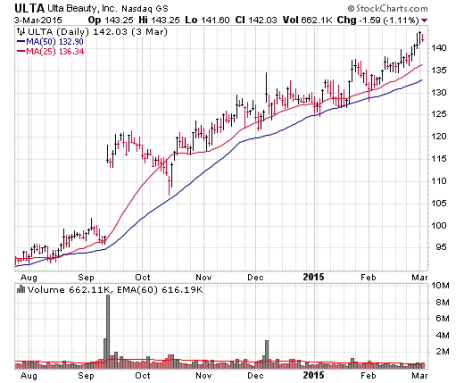
We found Ulta Beauty (ULTA), which was a solid winner for us a few years ago, via the 10x Rule. The stock had been correcting and consolidating for a few months before gapping up on earnings in September 2014—the move pushed the stock up 18% on 10.5 times volume. You can see the smooth advance that resulted; the stock eventually reached 315 before finally topping out!
Thus, just keep your ears and eyes open for these gaps. You can check out the stock’s trading volume (and its recent average) in many places online (Yahoo! Finance, Stockcharts.com, etc.). If you find a stock that fits the 10x Rule this earnings season, it should be a candidate for buying, assuming the story and numbers are sound and (ideally) the stock is coming out of a consolidation area.
Earnings Season Chart Pattern #2: The Two Towers
The second show of power is called Two Towers, and it takes a bit longer to identify. Here, we’re looking at the weekly chart and want to see two big weekly gains in the stock on tremendous volume following earnings. Even more than the 10x Rule, this pattern is seen kicking off many huge advances.
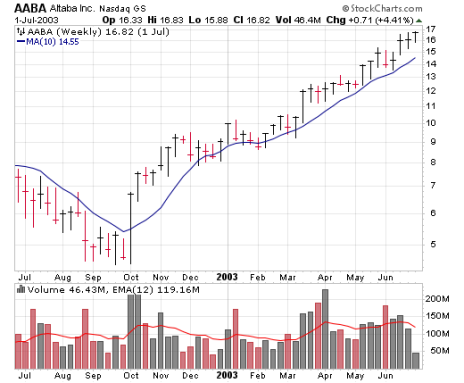
Way back in 2002, before even the end of the massive bear market, Yahoo!, which was crushed during the prior few years, exploded higher in early October on two massive weeks of volume. That turned out to be the low, and the stock was a big leader during the 2003-2004 bull move.
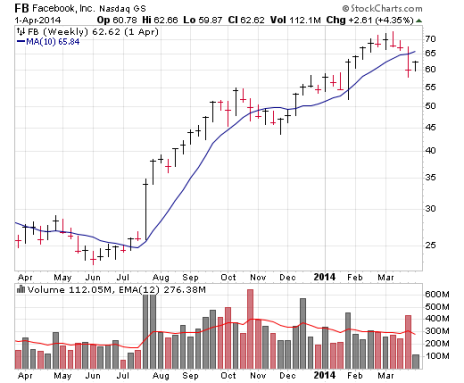
Facebook (FB) flashed its own Two Towers signal when it initially got going in July 2013. Even after those two weeks, the stock rose from 38 to 72 during the next seven months, and of course has continued to crank higher in the years since.
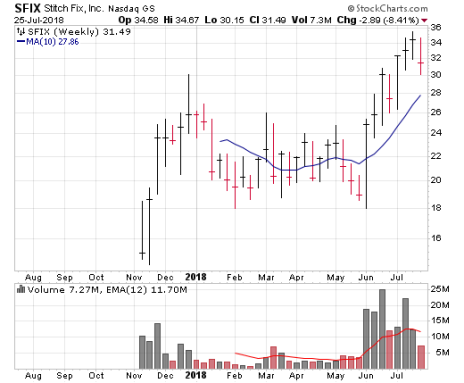
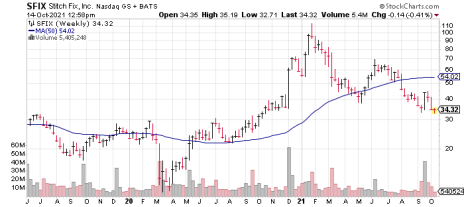
More recently, we saw the Two Towers signal with recent new issue Stitch Fix (SFIX). In fact, it was a Three Towers signal! After a five-month post-IPO sag, SFIX exploded higher on earnings in early June 2018—the first week was a huge gain, the second week was OK, and then the third was a huge again. And all came on giant volume!
While recent IPOs like SFIX are a bit less reliable when it comes to chart patterns, SFIX traded as high as 49 in the next few months before giving back some of its gains and consolidating sideways for a few years. Ironically, SFIX would trigger the 10x Rule itself due to a pandemic-induced earnings surprise. You can see how it follows that earnings chart pattern when it gapped from 35 to 50 before doubling at the beginning of 2021 (the economic reopening has since dragged the stock down to it’s prior levels).
What signals do you look for when the companies you invest in report earnings?
[author_ad]
*This post has been updated from a previously published version.

