As volatility subsides, stocks have formed a narrow range. A breakout will soon follow. Here’s how to know which way it’s headed.
It could change at any moment, given that the economic ramifications of this global pandemic are only starting to be realized, but right now, all is quiet on Wall Street. Too quiet. Six weeks ago, stocks moved up or down 4%, 5%, 6% (or more) on almost a daily basis. Now, volatility is back down to tolerable levels, and a clear trading range has emerged.
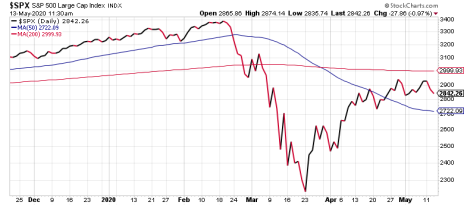
Since April 8, five full weeks, the S&P 500 has traded between 2,736 and 2,939—a top-to-bottom range that’s just 7.4% wide. Meanwhile, the CBOE Volatility Index (VIX) has fallen from a peak of 82 on March 16 to the low 30s now. That’s still really high—the VIX hadn’t topped 30 in more than eight years prior to the arrival of coronavirus. But everything is relative these days. And relative to what U.S. stocks were doing in March and the first half of April, this is what calm looks like.
[text_ad use_post='129627']
Narrow Trading Range: Calm Before Another Storm?
Will it last? I doubt it. Eventually, a breakout will arrive. It always does following a narrow trading range. The question is: Will the breakout be up or down? I’d be surprised if it’s up, frankly.
With unemployment at its highest level (14.7%) since the Great Depression, businesses all over America still shuttered, and no clear answer as to when things will return to normal in this country, there’s just too much uncertainty for stocks to keep rising after the big recovery in late March and the first half of April.
A year from now, I’d be surprised if stock prices aren’t higher than they are today. But the short-term is far less certain. And it seems the recovery was a bit overcooked.
That said, you shouldn’t stop buying back in just because stocks could fall again, perhaps even re-testing their March lows to form a traditional double bottom chart pattern. As our market expert Mike Cintolo is fond of saying, you have to go with the evidence in front of you. And right now, the evidence shows that things have gotten much better. As the chart below shows, the S&P 500 is trading above its 50-day moving average, and within striking distance of the 200-day line.
Going forward, here are three things I would look for if you’re trying to decipher which way the market is headed next.
3 Ways to Spot the Next Breakout
- A break from the current trading range. If the S&P breaks below 2,736 support or above 2,939 resistance, there’s a good chance it will keep heading in that direction for a while. It’s currently trading smack in the middle of that five-week range, so a breakout doesn’t seem imminent – if anything, the range may continue to tighten in the coming days and perhaps longer.
- A dip below the 50-day moving average. With the 50-day line just below support (currently 2,722), it would simply confirm that the breakout is to the downside.
- Any big movement in the VIX. As I said, the VIX is still historically high. If volatility continues to trickle downward, it would imply a continued period of relative calm. But another spike in the VIX—it hasn’t jumped above 37 since the last week of April—could signal that another market retreat is coming.
Now, if you want even more sophisticated market timing indicators, I highly recommend you subscribe to our Cabot Growth Investor advisory, where Mike Cintolo has developed his own, incredibly accurate criteria for identifying which way the market winds are blowing. It’s helped him—and his readers—achieve an average return of 49% on a portfolio full of growth stocks that have all been recommended within the last eight months!
To learn more, click here.
[author_ad]

