September and October are historically the worst two months for stocks. Considering the S&P 500 was already down more than 9% in the last three weeks of summer prior to Labor Day, that doesn’t bode well. Things could get even uglier in the coming weeks, and the major indexes may absolutely retest their June lows. But the current stock market pullback also looks fairly normal and is likely to lead to big gains in the year ahead.
For starters, a retreat on the heels of the 17% rally from mid-June to mid-August is not surprising. That two-month summer surge always had the makings of a bear market rally, and the last month seem to have confirmed it. With the Nasdaq down 27% year to date and 29% from its November 2021 highs, growth stocks in particular are still very much in a bear market.
Thus, the recent retreat has all the makings of a classic double bottom chart pattern, whereby stock fall precipitously, recover some (but usually not all) of those losses, then sink again, sometimes all the way back to previous lows. Will the indexes keep falling to their June nadirs? I wouldn’t bet against it. The S&P 500 would have to dip another 6% to get there, while the Nasdaq has about a 7.5% cushion. That’s not far-fetched, considering the two indexes have already plummeted even more than that in the last month.
[text_ad]
That’s the bad news. The current stock market correction likely isn’t over, especially in light of all the economic concerns (still-high inflation, an increasingly hawkish Federal Reserve, a likely recession) and geopolitical turmoil and uncertainty (the raging Russia/Ukraine war, the China/Taiwan situation, pivotal upcoming midterm elections in the U.S., etc.) hanging like dark clouds over investors’ heads at the moment. If I had to guess (and take this with an entire shaker of salt), I think the market will continue to retreat this month, perhaps all the way to or near June lows, then will settle into more of a holding pattern in October ahead of the November 8 elections.
The good news? History says things should much better from there. Here are three indicators as to why.
3 Reasons the Current Stock Market Pullback Won’t Last … Past November
Ryan Detrick of Carson Group (formerly of LPL Financial) is one of my favorite follows on Twitter (@RyanDetrick is his Twitter “handle”). My colleague, Jacob Mintz, turned me on to him a while back because Mr. Detrick is a close follower of historical market trends. Based on those trends, there are a couple reasons for optimism amid all the recent market pessimism.
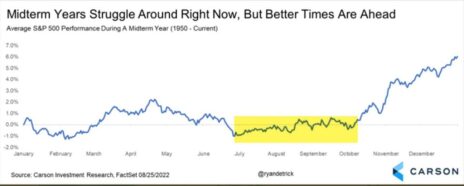
According to Detrick, in the average midterm election year, the S&P 500 is down through October 5, dating all the way back to 1950. However, the S&P finishes up 6% for the year on average, with all the gains coming in those last three months. Here’s the chart showing it, courtesy of Carson Investment Research and FactSet.
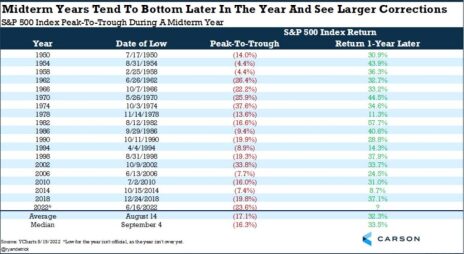
Going out even further, according to Detrick, the S&P rises an average of 32% off its midterm year lows in the 12 months that follow (see table below). In fact, it’s been up every time dating back to 1950, with the minimum 12-month gain being 8.7% in 2014. Hopefully those lows were already firmly established in June, but it’s possible the index could dip below them in the coming month or two.
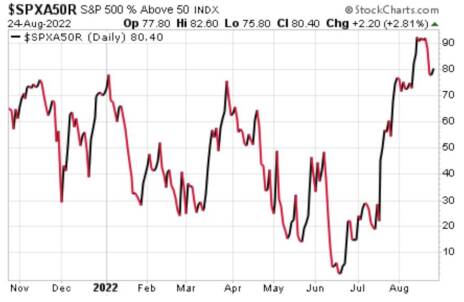
The last reason for optimism despite the sad state of the current stock market comes from our own Mike Cintolo, one of the best market timing experts in the business. Mike follows a number of very specific market timing indicators, and one of them flashed green in mid-August, as he wrote in the latest issue of his Cabot Growth Investor advisory. Here’s what he said:
“We saw 90% of S&P 500 stocks rise above their 50-day lines on Friday, August 12, and when combined with a couple of important qualifiers (it’s the first signal in at least six months; S&P 500 has been below its 200-day line sometime in the prior three months), it’s occurred 10 other times since 1990 (less than once every three years).
“And it’s almost always been bullish: During the following six months, the S&P’s maximum gain was 13%, vs. a maximum loss of less than 2%, with bigger gains (23%) on average looking out 12 months (with the same small 2% max loss). The gains are even more dramatic when looking at the Nasdaq, with an average max gain of 37% looking out a year!
“To be fair, of the 10 signals, there was one that led to a quick pullback (7% deep) before taking off, while another saw the market mostly do nothing (good or bad) during the next year. But none were true stinkers, and many were fantastic.”
Clearly this 11th signal is again leading to a quick – and even deeper this time – stock market pullback, but if it follows the previous 10 occurrences, chances are it will lead to decent returns in the ensuing six months and likely major returns (especially in the Nasdaq) in the following year.
So while the current stock market is pretty depressing, all the data – from two expert stock market historians – points to stocks being higher in the coming months and MUCH higher in the coming year. Keep reminding yourself of that if the indexes continue to fall in the next few weeks.
You may not have a crystal ball (neither do we), but how do you expect stocks to move in the coming months? Let us know in the comments.
[author_ad]


