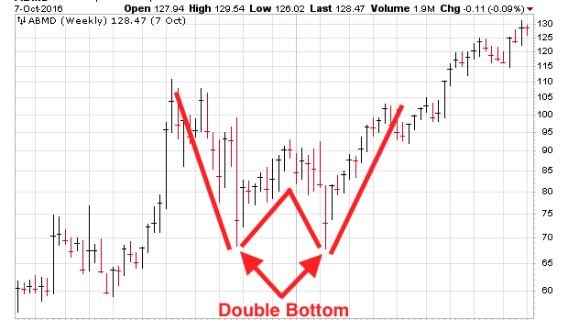
A double bottom chart pattern is a chart pattern used in technical analysis to describe the fall in price of a stock or index, followed by a rebound, then another drop to a level that’s roughly similar to the original drop, and finally another rebound.
Consequently, the double bottom chart pattern resembles the letter “W.”
This “W” pattern forms when prices register two distinct lows on a chart. However, the definition of a true double bottom is achieved only when prices rise above the highest point of the entire formation, leaving the entire pattern behind.
[text_ad]
The Double Bottom Is a Reversal Pattern
Put another way, the double bottom chart is a “reversal pattern” in an equity price’s downward trend. The price drops to a floor—a “support level”—before rallying back up, then falling to the support level again, before finally beginning a new uptrend.
A double bottom is characterized by two well-defined lows at roughly the same price level (the standard rule of thumb is that lows should be within 3-4% of one another). Double bottoms are among the most reliable chart patterns, although timing can vary tremendously among stock charts.
For example, double bottom patterns can be discerned within charts that are intra-day, daily, weekly, monthly, yearly and longer-term. The two lows should be distinct.
According to technical analysts, the second bottom tends to be rounded while the first tends to be distinct and sharp, simply because the first bottom is created at the maximum point of panic selling, while the second bottom is built—generally—by a slower process that occurs after traders who bought the first bottom get out (taking profits) and let the stock drift back to its previous low before longer-term investors slowly step in.
The pattern is complete when prices rise above the highest high in the formation. The highest high is termed the confirmation point.
Typically, a double bottom’s trading volume is greater on the left bottom than on the right.
Volume usually peaks as the pattern hits its first low and is somewhat less when the second low is created. (If volume is not lower on the second low, beware; the stock is at risk of falling to even lower lows!) Volume increases again as the pattern completes, with buying power rushing in to push the stock upward through the confirmation point.
Why Is This Chart Pattern Significant?
If accurately identified, the double bottom can signal an excellent entry opportunity for investors because it indicates that the stock has reached a crucial support level and is encountering difficulty moving lower. That implies that the stock has formed a low and is now positioned for an upward move.
How to Buy the Pattern
Traders who are adept at managing short-term risk can try to buy soon after they identify a potential double bottom. If they are right, they will soon take some quick profits, and if they are wrong, they will soon take a small loss as the stock falls below the false double bottom.
But investors who try to buy bottoms (just like investors who try to sell at tops) are at a greater risk of encountering a false signal, where the underlying stock attempts to put in a second bottom but subsequently breaks down. And if they are not adept at managing short-term risk, their losses can mount quickly after the double bottom fails.
More conservative investors, however, will be more patient when it comes to using the double bottom pattern. Rather than trying to pinpoint the bottom, waiting for confirmation (when the price breaks above the rebound high in the middle of the “W”) can help prevent false starts or buying ahead of failed breakouts.
The double bottom is seen as establishing a strong support level, and it’s a good place to consider adding stop-loss orders or mental stops as a subsequent break below that level would show that immediate support failed and the stock may have further to fall.
[author_ad]
*This post is periodically updated to reflect market conditions.

