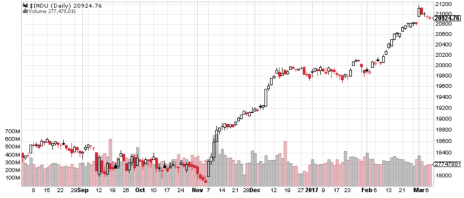
Financial news sources were buzzing last week as the Dow-Jones Industrial Average topped 21,000 in the wake of an unusually temperate speech to Congress from President Trump. Dow 21,000, and the rapid advance to this milestone, was in sharp contrast to what happened when the venerable index faced its earlier psychological barrier at 20,000.
From the middle of December until late January, the Dow teased investors by slipping sideways just under 20,000 for six tantalizing weeks! Investors were fascinated by this pause in the Dow’s advance, coming as it did after a post-election rally that began with the index under 18,000 and roared past 19,000 with ease.
The Dow’s flirtation with 20,000 was almost diabolical, as the index actually traded at an intraday high of 19,999.63 on January 6, then pulled back.
[text_ad]
The Dow finally broke through 20,000 on January 25, and while it dipped under that mark for a couple of days, the advance held and the Dow soared in February, blowing past 21,000 with ease on March 1. Here’s what the entire drama looked like.
What does Dow 21,000 for you as an equity investor? Well, unless you happened to have a chunk of your retirement income allocated to a Dow index fund, not much.
Of much more importance to index investors is the performance of the S&P 500, the preferred target for many methodical investors. According to Business Insider, the total amount of money invested in S&P 500 mutual funds in 2016 was $4 trillion (with a T!). And that doesn’t count the exchange-traded funds that have gained enormous popularity as investors realized that they could get the same exposure as an index fund without having to pay management fees. Just one of those ETFs (SPDR S&P 500 ETF, whose symbol is SPY) has net assets of over $235 billion.
It’s great that the Dow, the S&P 500 and the Nasdaq are all doing well, having recently scored new highs.
What’s not so great is that the investors who put their retirement money into the S&P 500 Index have been through a period of epic stagnation. From Christmas 2014 to a few days after Halloween 2016, which is nearly two years, the S&P 500 made zero net progress. The Index traded at 2,087 on December 23, 2014 and closed at 2,085 on November 4, 2016.
And the Dow’s flat patch was even longer, stretching from December 3, 2014 to November 4, 2017.
Sure these numbers are cherry-picked. But they are also correct. Your investments that were tied to these major indexes loafed their way through almost two years. And no matter how well they are doing now, your portfolio will never get those two years back.
The lesson for investors is clear. Passive investing in indexes is a risky business, even if you ignore the Twin Craters of the years 2000 and 2008.
To heck with the Dow 21,000. It’s an empty accomplishment except for one thing, which is that it means the stock market is going up. And when the market is going up, it’s a signal to growth investors that conditions are ripe for investing in growth stocks, which are always ready to offer a canny investor a chance to bet the indexes like a cheap drum.
Want to know more about growth investing? Cabot Wealth is ready to help.
[author_ad]

