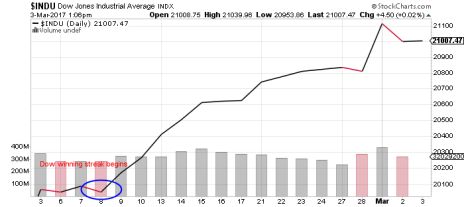
Stocks in general have been on a tear since the U.S. presidential election, but what’s happened in the Dow Jones Industrial Average has been truly historic. The recent Dow winning streak, which spanned 12 trading days, was its longest in 30 years, pushing it above 21,000 points in the process.
When you consider that two days prior to the election, the Dow was at less than 18,000 points, the recent Dow winning streak looks even more remarkable. Since November 4, the index is now up more than 17%—a better Dow return than all but three full years since the turn of the century!
The S&P 500 has been no slouch either, rising 14% in the last four months. Even better: the benchmark U.S. index is now on the cusp of 100 straight trading days without a 1% down day, the longest such streak since 1995. In fact, according to MKM Partners, the S&P has gone 76 trading days without so much as a 1.5% drawdown from its 52-week highs—the longest streak since 1960.
The New Bull Market and History
In other words, a new bull market is in full force, as predicted by our market expert Mike Cintolo in this space last year. However, all stock market trends eventually come to an end. Does that mean we should be worried about a massive stock market comeuppance after the historic Dow winning streak and the S&P’s 100-day aversion to big down days?
[text_ad]
After all, if you go back to 1987, the last time there was a Dow winning streak this long, the index peaked at a then-record 2,663 points in July of that year, and by November was down in the low 1,800s, losing nearly a third of its value in just three months. It took the Dow nearly two years to fully recover, as it didn’t top 2,600 points again until June 1989.
On the flip side, in 1995, the last time the S&P made it at least 100 straight trading days without a dropoff of 1% or more, large-cap stocks closed the year at 645 and kept on motoring to 757 by the end of 1996, topped 1,000 points for the first time in late 1997, and didn’t stop rising until the turn of the century when the dot-com bubble burst.
So that doesn’t tell us much. Stocks could either keep on trucking for another couple years, with a few minor speedbumps along the way, or we could be in for an extended collapse like we saw after the 1987 peak. I’d bet on the former.
According to Mike Cintolo, the current market environment looks a lot more like 1984 than 1987. Last October, Mike did a stock market comparison between 1983-84 and 2015-16, illustrating why he thought we were on the cusp of a new bull market. Mind you, this was a little over a week before the post-election breakout that has yet to end.
Here’s what Mike wrote then:
“In 1982, the secular bear ended with an incredibly strong rally that took the S&P 500 to new all-time highs during the following year. But starting in mid-1983, stocks began a long sideways phase that looks a lot like the past 15 months we’ve experienced.
“Specifically, that 1983-1984 decline fell a maximum of just 14.8% over about 11 months, then had a strong up-thrust that caused all sorts of blastoff indicators to flash green. However, instead of surging from there, the S&P 500 meandered sideways for another five months in an even tighter range (about 6% from high to low) before finally exploding higher—the market doubled by late 1987!
“This all lines up pretty well with what we’ve seen over the past few years.”
So far, Mike’s October prediction of a massive market breakout has been spot on. If history is any guide, the new bull market could continue for quite some time.
[author_ad]


