We’re knee deep in earnings season, which means we’re seeing plenty of earnings reactions result in big gaps on the chart—most of them on the upside, but plenty on the downside as well. These gaps lower have led to a common question: “I’ve been following XYZ stock for a while but never jumped in—is it a good buy now after the dip on earnings?”
The answer, as usual, is that it depends. Years ago, few investors paid attention to earnings gaps, and if they did, most tend to fade them—that is, they’d sell a huge gap up and think a massive gap lower produced a bargain. History, though, said the opposite—that big, powerful earnings gaps tend to persist in the intermediate term (not always, of course, but in most instances).
However, over the past 15 years, earnings season and its dramatic moves in many leading stocks has produced a lot of coverage, and because of that, many investors have “over-interpreted” earnings reactions—any time a stock we hold falls on earnings, I usually receive a ton of questions about whether it should be sold.
[text_ad]
That’s what today’s article is about: sharing some pointers about how I determine whether an earnings gap is abnormal weakness, normal or even buyable. The decision usually comes down to the chart, both recently and the action over the past few months.
Specifically, I’m looking at a few things:
- The size/volume of the earnings gap down and the close on the day
- Where the stock is in relation to its 50-day line
- The stock’s action of the past few months (big run-up?)
- Relatedly, how far the stock might be in its overall run
- Any major, obvious changes to the growth story.
I can’t cover every scenario, obviously, but below are three instances that played out recently and how I interpreted them.
3 Earnings Reactions
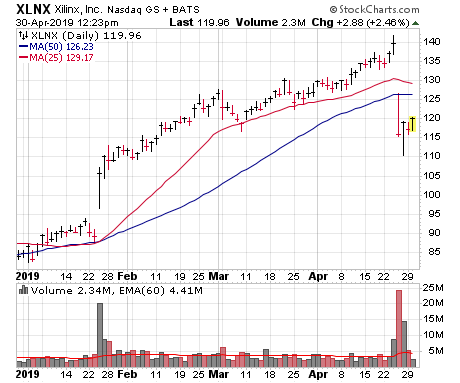
Earnings Reaction #1: Xilinx (XLNX)—The Breakdown
What happened: XLNX has been what I considered to be one of the liquid leaders of this rally, showing great relative strength during last year’s market correction, soaring on earnings in January and running up as high as 140 before earnings last week. Then came the earnings plunge, with shares sinking as low as 110 before bouncing.
Factors: The gap was large (18%), came on the heaviest daily volume since 2014, took the stock clearly below the 50-day line and, as written above, came after a big run so far this year. That said, prior to last fall, XLNX hadn’t done much in a long time—i.e., the advance wasn’t super long in the tooth. Finally, fundamentally, we would say that the mundane earnings estimates that many thought were too conservative now are looking “real”—analysts see the firm’s earnings up just 10% this year and 14% next.
Conclusion: XLNX has topped for the intermediate term and is likely to need many weeks of repair. It could easily bounce a few points, no question, but a sustained run of many weeks or months is likely to need a new base-building effort. If I still had a huge profit, I might hold some, but in most cases I’d be leaning toward trimming or selling the position and looking for stronger situations. We had XLNX in Cabot Top Ten Trader (initially recommended way back on October 29 when it was trading in the high 70s) and advised selling it last week.
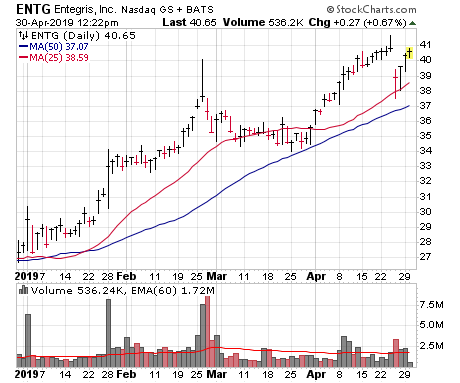
Earnings Reaction #2: Entegris (ENTG)—The Alert
What happened: ENTG isn’t well known, but the stock had been showing some solid accumulation off the market bottom, thanks in part to a game-changing merger that was announced in January. It even tested its 50-day line and ran to new recovery highs around 41 when earnings were announced.
Factors: You can see the reaction on April 25, as the stock gapped lower and was off by as much as 6% during the day. Volume, though, while above average, wasn’t overwhelming, and shares never touched their 50-day line and actually closed above their (red) 25-day line. Bigger picture, the report was decent (no major change in earnings estimates) and shares had only been running for three-plus months before the report.
Conclusion: Such action is mostly an “alert” in my book. Could it be a top? It’s possible, but you can’t conclude that given the action. ENTG is followed in Cabot Top Ten Trader, and we’re still holding on, albeit with a reasonably tight stop near 37. If it continues to bounce, it should be OK, but if it cracks its earnings low/50-day line, it likely needs a deeper correction.
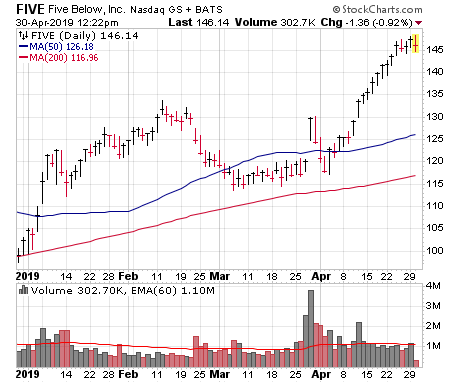
Earnings Reaction #3: Five Below (FIVE)—The Shake and Bake
What happened: FIVE was one of a few stocks whose earnings reaction was actually positive, with shares gapping up from 120 to 130. But that was followed by a big-volume dip the next three days that took the stock back to 117 or so. And all of this came after a few months of no net progress, with a few rejections in the 135 area.
Factors: As we just said, the total post-earnings move (gap up and reversal) wasn’t all that bad, down just a few points. And the three-day selloff did come on lower trading volume that the initial pop. FIVE did close below its 50-day line after the reversal, but notice how it was above a recent low. Meanwhile, fundamentally, earnings estimates actually rose after the report.
Conclusion: We’ve owned FIVE for a while in our Cabot Growth Investor Model Portfolio, and our advice after that was simple: We were watching support in the 110-114 area (below its recent lows and near the green 200-day line); a break off there would have caused us to sell some (maybe all) of our position—but it held, and now FIVE looks to be early in a new advance, hitting new highs after a seven-month rest.
Bottom Line
Knowing the difference between normal and abnormal chart action is one of the keys when it comes to deciding to hold onto or sell a stock. It’s allowed Cabot Growth Investor subscribers to hang in there with numerous big winners in recent years, and is one reason why we’re up nearly 20% so far this year. For more information on how to become a Cabot Growth Investor subscriber, click here.
[author_ad]


