As it Does Most Summers, the Trading Range Has Narrowed. What Happens Next is Where Things Get Interesting.
It’s an annual rite of passage on Wall Street: as temperatures rise, trading ranges shrink.
As hedge funders and day traders head to the beach for summer vacation, trading volume naturally dips, volatility calms, and the stock market stalls. July, in particularly, is historically the lightest trading month of the year, and was again in 2018. And like last July, we’re seeing some serious tightening in the market.
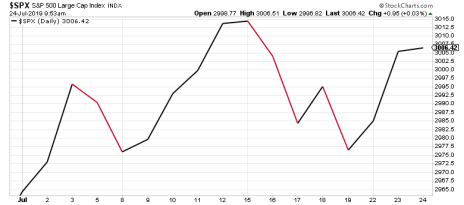
Here’s what a chart of the S&P 500 looks like so far this July:
The index closed its first day of July at 2,964 and has risen as high as 3,014—a gain of 1.68%. As of this writing, it’s down to 1.4%, with 2,975 acting as the new bottom of the trading range. When you consider that stocks were up 6.9% in June and down 6.5% in May, the relative lack of movement this month has been a welcome change.
[text_ad]
But it’s actually been an active month by July’s standards. According to the Stock Trader’s Almanac, the S&P gains just 0.9% in an average July. There’s even less movement in August, when the index is essentially flat. Thus, in the aggregate, stocks gain a mere 0.9% in July and August (dating back to 1950).
So, tight trading ranges are the norm this time of the year. But what usually happens when investors return from their summer vacations?
Let’s look back at the last five years of market behavior, and compare what’s happened in July and August with what’s happened in September and October.
S&P 500 Gain/Loss%
July-August September-October
2014: +1.1% +1.2%
2015: -0.07% +9.3%
2016: +3.7% -4.4%
2017: +2.2% +4.5%
2018: +6.7% -6.5%
Avgs.: +2.7% +0.8%
A few takeaways here. One, there’s been much more movement in stocks in July and August the last five years than usual—almost all to the upside. And two, despite the net 0.8% gain during those five years, the ensuing move in September and October is almost always more pronounced.
Last October, of course, was the beginning of the fourth-quarter market correction. 2016 brought a similar correction, though that one was thankfully tamer.
On the flip side, 2015 and 2017 brought big upmoves in stocks once Wall Street returned from vacation in September. So the market breakout can go in either direction following the summer doldrums.
That’s reflected in the historical average for September and October. September is typically the worst month for stocks, with an average loss of -0.5%. October is more middle-of-the-pack, with an average gain of 0.7%. Thus, the normal September-October move is a retreat followed by a quick recovery.
Tight trading ranges like the one we’re seeing now are normal for this time of year, and chances are this one will continue well into August. What happens after that is less predictable.
But one thing is clear: when summer ends, stocks start to move, breaking free of their mid- to late-summer shackles.
Which way they go is anybody’s guess. But if it’s anything like the usual September, expect a pullback starting in about a month.
[author_ad]


