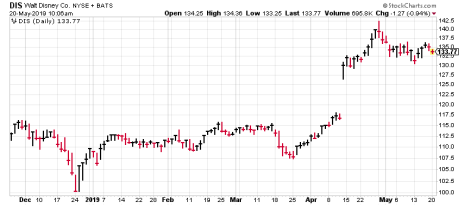
Today I want to talk about Disney stock, which has been in the news due to last month’s big announcement of its new streaming platform, which caused the stock to go bananas, at least for a couple weeks. There are two investing lessons that I immediately thought of when I examined the company and the chart.
Lesson #1: The Company is Not the Stock
The first: The company is not the stock, which is a hard concept for most investors to really grasp. Obviously, in a loose way, a stock (or market) will follow the fundamentals; if sales and earnings are headed up over time, the stock is likely to as well. But it’s far from a one-to-one relationship, and many investors are surprised to see how long a stock can be disconnected from the performance of the underlying company.
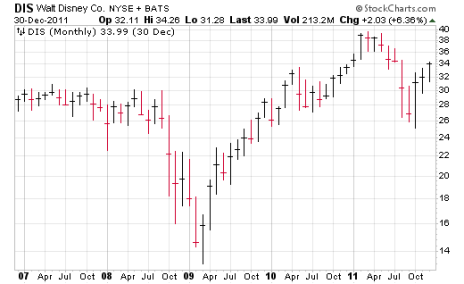
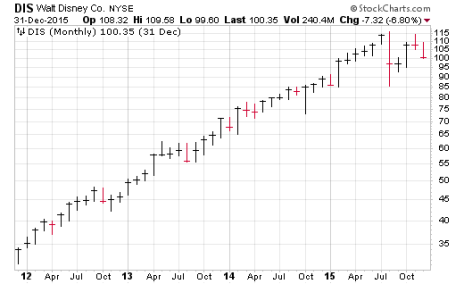
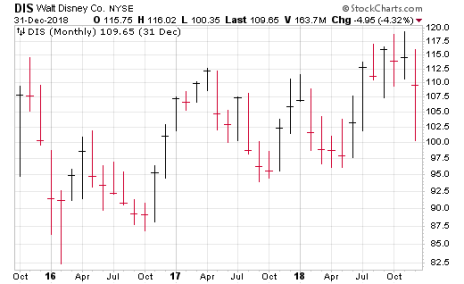
Shown below are three monthly charts that together cover Disney (DIS) action from 2006 to 2018.
[text_ad]
The first period is from early 2007 through the end of 2011, five full years of action. During this period, business was pretty good for Disney the company—sales rose 21% total during those five years, while earnings per share ran from $1.56 in 2006 to $2.54 in 2011, up a very solid 63%. Even the dividend, while modest, rose nicely.
What did Disney stock do? Not much! The stock was around 34 at the end of 2006, and it was sitting around 35 near the end of 2011.
The second period goes from that point—the start of 2012—right through 2015, encompassing four years of trading. Disney the company grew even faster during this time, with earnings moving from $2.54 per share in 2011 to $5.15 in 2015, roughly a double, while sales advanced 28%.
And how did the stock do this time? Amazingly well, powering ahead from 35 or so to a high of 122 in 2015 (though it closed the year around 105), a gain of around 250%!
The third period includes 2016 through 2018—three years of action. Disney the company saw slowing growth, but things weren’t too bad, with sales rising 13% over that three-year span, while earnings advanced a total of 37%.
But the stock didn’t respond, closing last year around 110, which was 10% down from its mid-2015 highs.
The lesson here is that what really moves a stock is investor perception of the firm’s future earnings prospects. It’s perception that causes a stock’s valuation to wax and wane over time—the P/E ratio for DIS fell from 20 to 14 during the first period, rose from 14 to 19 during the second period, then fell again (from 19 to 16) during the third. Earnings did pretty well during all three periods, but perception of those bottom line gains changed over time.
This is why charts are so important. Charts aren’t crazy voodoo magic and they don’t contain black box secret messages. They’re simply a way of seeing whether a stock is under strong accumulation (perception is improving), chopping around (perception isn’t changing much), or trending down (perception is worsening).
Which leads me to the second lesson.
Lesson #2: Never Underestimate a Big, Liquid Stock that Breaks Out on Huge Volume
One of the key chart clues that points to a big change in perception that should last is when, after a long consolidation, you see a monstrous upside breakout on massive volume. When that breakout comes from a big, liquid stock, it’s all the more powerful given the dollar volume of shares that are being bought.
That’s just what Disney stock did last month, and I explained the reasons why in this a recent edition of Cabot Top Ten Trader:
“When we see a huge, well-traded name like Disney soar out of a long consolidation on eye-popping volume (usually because of some growth-y news), we don’t underestimate it. After a huge run from 2011 to 2015 (as earnings doubled), the stock has been stuck in a rut as the core business has struggled and its media properties lagged. But growth did pick up a bit last year (sales up 8%, earnings up 24%), and while analysts’ current estimates look poor, there’s a new reason to get excited.
“Last [month], the company announced details on its long-awaited streaming plan, dubbed Disney Plus—the content will be relatively rich (all Star Wars movies, 18 Pixar films, 5,000 episodes of various Disney shows, all seasons of The Simpsons, a dozen Disney movie classics and its first original content show named Mandalorian, and much more), ad free and costing just $7 per month (or $70 per year). And along with that management released a ‘wow’ forecast for Disney Plus (60 to 90 million subs by 2024) and its other streaming properties (Hulu, which is 60% owned by Disney, should have 40 to 60 million subscribers by 2024, with ESPN Plus getting 10 million or so).
“Obviously, those are long-term guesstimates, competition is intense and the firm will incur a lot of upfront expenses—but big investors are now viewing Disney as likely to be a leading streaming player both here and overseas in the years ahead. It’s a very intriguing story.”
Disney Stock Today
You can see what the stock did in response—it ripped to new highs on its heaviest trading volume in four years! To many investors, such a huge move from DIS means it’s come too far, too fast, and indeed the stock has pulled back some from its late-April top and settled into a tight trading range between 133 and 135 this month. That’s a bullish pattern for the short term, and history tells me that the outsized buying power is portending a long-term change for the better in perception … a change that’s likely to persist as more big investors come around to the view that Disney’s streaming efforts will take root.
It’s not going to set the world on fire, but my guess is that Disney stock will do surprisingly well in the months ahead.
To receive more updates on Disney stock or to get access to all momentum stocks featured in Cabot Top Ten Trader click here.
[author_ad]
*This post has been updated from an original version.
