I’m not getting a ton of emails these days, which I hope means most of my subscribers are (mostly) safe in cash and focusing on other important things (like what to grill for dinner and what book to buy for a beach read). But the few emails I do get generally focus on either some individual (usually commodity) stock, what indicators to look at, or simply ask: “How is the market looking to you? Are we close to the end of this?”
So for today’s Wealth Daily, I figured I’d just go ahead and share a bunch of things I check regularly—some are indicators, some are recent market events, but all are things on my mind right now as we see if the market can return to health. They were all big reasons I’ve held an average of 60%-plus cash during the past six months, and will be big reasons why I again get heavily invested. And there are some reasons for optimism right now.
[text_ad]
Let’s get started.
8 Indicators to Watch
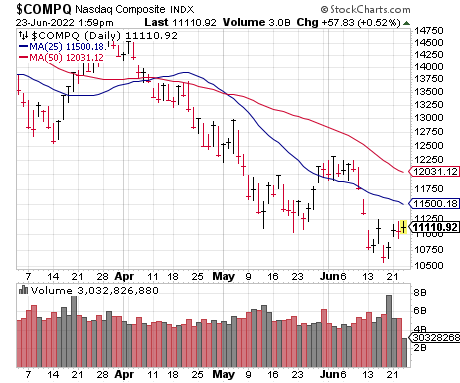
- Cabot Tides: This is my key intermediate-term trend model, shown and written about in every issue of my Cabot Growth Investor In a nutshell, we need to see most major indexes we track (such as the Nasdaq, shown below) get higher than they were five weeks ago—it came close recently, but as you can see by the chart, close doesn’t cut it. Need to see more.
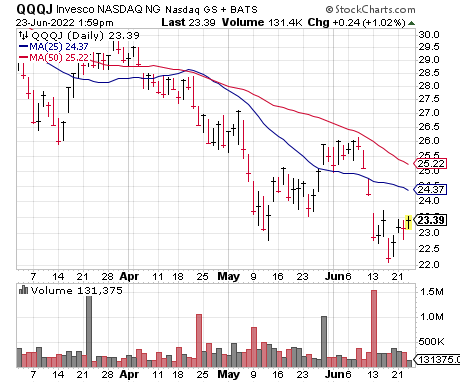
- Growth Tides: Same as above, but instead of a handful of major indexes, I’m looking at a handful of growth funds and ETFs; these tend to have a closer (not perfect) correlation to the growth stocks I tend to invest in. The Next-Generation QQQ (QQQJ) is one of my favorites, and it’s in a similar position to the major indexes.
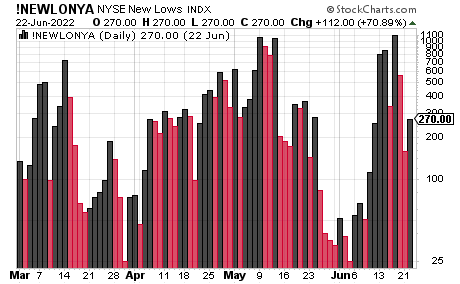
- Two-Second Indicator: One of your first, best indications that the market has truly changed character is seen in the number of stocks hitting new 52-week lows (which we call our Two-Second Indicator, as it only takes two seconds to check each day). Usually these figures will quickly decline below 40 and even 20 many days in a row soon after a major low. Action until a few days ago was encouraging, but (detecting a theme here!) need to see more.
- Recent “mini-thrusts,” Part 1: OK, this isn’t something to monitor because it’s already happened, but it’s something to keep in mind. On the three days leading up to Memorial Day, the NYSE saw 80% of all trading volume flow into rising issues all three days, just the 13th time that’s happened since 1970. Three months later, the S&P was higher 11 of those 13 times by an average of 6.4%.
- Recent “mini-thrusts,” Part 2: During those same three days, 70% of all NYSE issues were up each day, which is also relatively rare—about three months later, 85% of occurrences led to gains, again in the average range of 6% or so for the S&P 500. To be clear, these shorter-term signs of power are good to see, but they’re not something I usually trade off of. Still, I’m keeping them in mind as both have been seen at a few key bottoms through the years.
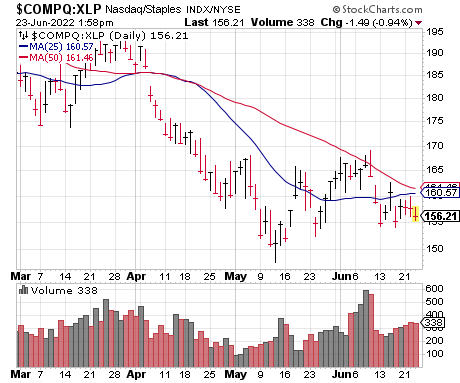
- Cabot’s Aggression Index: This is related to the Growth Tides in the sense that it gives me a quick measure of whether big investors are buying growth (Nasdaq), or safety (the consumer staples fund, XLP). It’s improved of late, but like most things, needs more work to conclude there’s been a character change toward growth stocks.
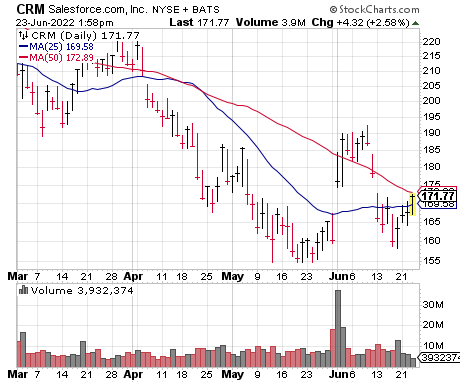
- Bottoming Gaps Holding: I’m not interested in buying stocks that are down 60% or 70% from their highs, as the odds strongly favor other, more resilient (and likely newer) names will be the leaders of the next advance. But it’s also true that the market is unlikely to get moving if the worst stocks keep sinking. Thus, I’m keeping an eye on some bottom feeders that recently gapped on earnings, especially if they’re big and liquid. Salesforce (CRM) is a good cautionary tale; it gapped up off the bottom in early June but closed the gap two weeks later.
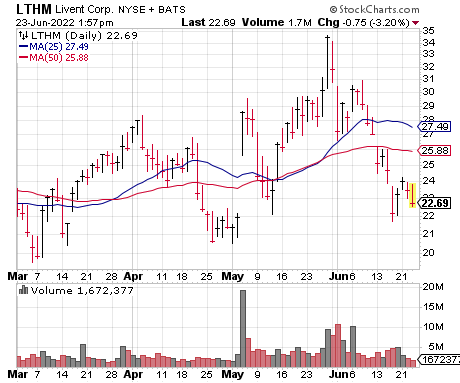
- Breakouts Holding: This has been, by far, the most telling thing in the market all year—even during the brief March rally that sputtered out. All year, next to nothing (outside of commodity stocks) has been able to move above key resistance and hold the move … and, frankly, I’m still seeing that today, with the latest example being lithium stocks like Livent (LTHM), which went vertical a couple of weeks ago and then immediately came back down to Earth. At day’s end, for the market to head up, stocks will have to hit multi-month highs and keep rising—so far, though, it hasn’t happened.
What indicators do you use? Are there any not mentioned above you have your eye on these days?
[author_ad]
