The Federal Reserve just raised short-term interest rates again, by a quarter of a percent, as is their wont. The move pushes the Federal funds rate above 2% for the first time in a decade—before the 2008-09 recession. Another rate hike might give some investors angst about what it could do to stocks in the coming days and weeks. But one look at an interest rate timeline over the last couple years should quell any such fears.
Let’s start with the recession, which prompted the Fed to lower interest rates to near zero (0.25%, the lowest Federal funds rate possible) in December 2008. Rates stayed near zero for a full seven years, until the Fed finally bumped them up to half a percent in December 2015 in response to an improving U.S. economy.
As the economic recovery has strengthened, the Fed has raised interest rates six more times (including Wednesday’s rate hike), each time by a quarter of a percent. Wall Street has held its collective breath before each and every hike, but the trepidation has been needless.
[text_ad]
Here is an interest rate timeline that shows each Fed rate hike over the last two and a half years, and the market’s response in the weeks and months that followed.
Interest Rate Timeline
Dec. 17, 2015: Fed hikes rates for the first time in seven years
Market response: S&P 500 +2.2% in the next three months
Dec. 14, 2016: Fed hikes rates to 0.75%
Market response: S&P 500 +4.1% in the next two months
March 15, 2017: Fed hikes rates to 1%
Market response: S&P 500 +2.3% in the next three months
June 14, 2017: Fed hikes rates to 1.25%
Market response: S&P 500 +1.2% in the next six weeks
December 13, 2017: Fed hikes rates to 1.5%
Market response: S&P 500 +4.7% in the next month
March 21, 2018: Fed hikes rates to 1.75%
Market response: S&P 500 +0.8% in the next two months
June 13, 2018: Fed hikes rates to 2%
Market response: ??????
It’s not a perfect timeline. Stocks didn’t immediately shoot up after each rate hike. In some cases, they were down initially before rallying. But my point with this interest rate timeline is not to insinuate that Fed rate hikes somehow trigger market rallies. Rather, it’s to show that they don’t cause the kinds of short- or intermediate-term market corrections the way some pundits feared when the Fed started hiking rates again.
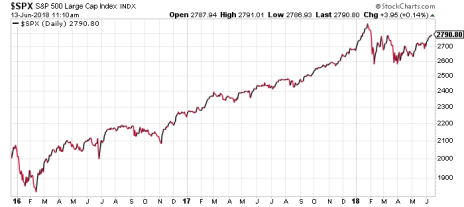
In all six cases, stocks were higher three months after the rate hike than they were before. For a larger-picture perspective of what stocks have done in a rising-interest rate environment, here’s a chart of the S&P 500 over the last two and a half years.
All told, that’s a 39% increase in U.S. stocks—better than the 26% run-up in large-cap stocks in the two and a half years that preceded Fed rate hikes!
The takeaway? No matter how stocks behave today, yesterday’s rate hike isn’t likely to have an adverse effect on the market; and if there are two more rate hikes this year (as the Fed forecast on Wednesday), don’t sweat it. After all, rising interest rates are the Federal Reserve’s nod to a robust U.S. economy. That’s a good thing!
And as the above interest rate timeline shows, it hasn’t slowed stocks one iota. Other things may throw a wrench into this bull market. But don’t expect interest rates to have much to do with it.
[author_ad]


