The bond market is getting dangerously close to flashing a most unwanted signal: an inverted yield curve, meaning that interest rates on long-term government debt fell below short-term yields. History shows that when long-term bond yields dip below short-term yields, a recession eventually follows. However, between the onset of an inverted yield curve signal and the recession it typically portends, good things tend to happen for stocks.
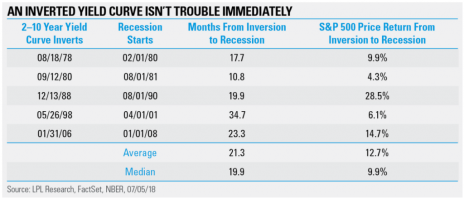
According to research firm LPL Financial, a U.S. recession didn’t arrive for an average of 21 months after the yield curve inverted. The average returns in the S&P 500 during those 21 months? 12.7%.
A History of the Inverted Yield Curve
Here are the stats broken down by year (table courtesy of LPL Financial and FactSet):
First, there’s one major caveat to this graphic, which as you can see is nearly four years old: it does not include the last time the yield curve inverted, in August and September of 2019. Like the others, it led to a recession months later (in April 2020), but under historically abnormal circumstances: the worst global pandemic in 100 years. While stocks did rise roughly 12% from early September to the top in mid-February 2020, the unique timing of that yield curve inverting and the ensuing recession make it nearly impossible to lump in with the others. So, I’m throwing it out.
Instead, let’s focus on the five instances in LPL Research’s above graphic. There’s good news and bad news here.
The good news is that those panicky headlines about a recession being imminent are a bit premature. The five non-Covid-tainted times the yield curve signal has flashed in the last 45 years, the quickest a U.S. recession has followed was in 1980-1981, when there was an 11-month lag between the two. The longest gap between a yield curve inverting and a recession commencing was from 1998 to 2001, a nearly three-year gap between the two.
[text_ad]
Using that data, we should expect another recession no earlier than next February, and as late as 2025. In the meantime, stocks should fare quite well—they’ve never fallen in the time between the onset of the yield curve inverting and the start of the ensuing recession - including in 2019-20 - rising as much as 28.5% in one instance.
The bad news, of course, is that if the yield curve does in fact invert, a recession seems likely. According to the San Francisco Federal Reserve, a negative curve has forecast all 10 previous U.S. recessions. The prospect of an impending recession is daunting for all investors.
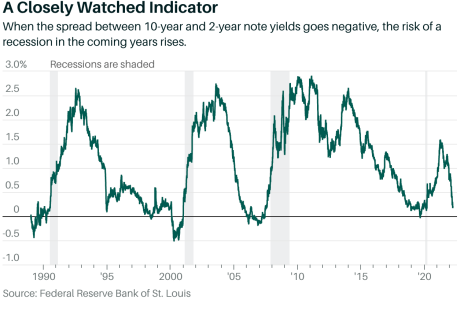
Here’s how close we are to the yield curve inverting now (chart courtesy of Federal Bank of St. Louis):
What to Make of the Possible Inverted Yield Curve
A couple things here. First, the yield curve hasn’t actually inverted yet, though it is close. Second, with or without an inversion, it’s doubtful a recession is close enough for stocks to start cratering now; not with U.S. inflation still at 40-year highs, with no sign of abating anytime soon, or at least not without an abrupt (and unexpected) ceasefire in Ukraine. While a real possibility, recession is a down-the-road concern.
If you believe the history of yield curves inverting, we could have another 21 months (give or take) before we have to start batting down the hatches in preparation for another recession. Until then, there’s money to be made, and good stocks abound.
I recommend you take advantage of it while you can!
[author_ad]
*This post has been updated from an original version, published in 2019.


