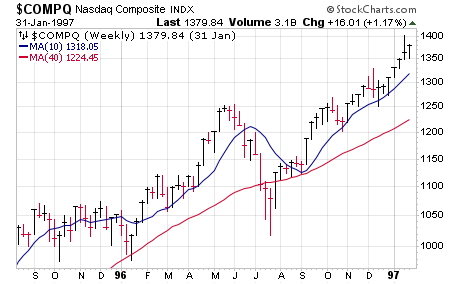
The Nasdaq correction of the last three months has been frustrating for growth investors. But these four charts show that it typically ends well.
If you’re focused on growth stocks like us, then the past three months have obviously been a downer, and the near term still looks iffy following so many horrendous earnings reactions among growth stocks. However, we want to write about the fact that this Nasdaq correction - which already seems to be easing up a bit in the past week—doesn’t appear abnormal from a big-picture point of view.
We say that not because of some rah-rah attitude, or because other areas of the market (cyclical stocks, etc.) are still doing OK. Instead, it comes from some studies of what often happens after a huge market up year, especially in the Nasdaq. It turns out that a fairly deep, multi-month Nasdaq correction is relatively normal—and is followed by another leg up.
[text_ad]
4 Past Nasdaq Corrections that Led to Good Things
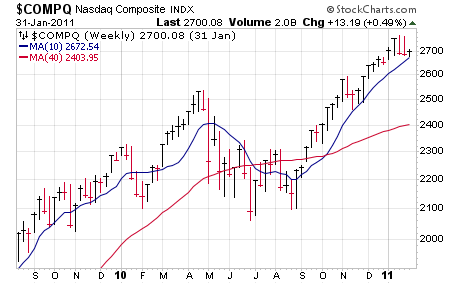
Let’s take a look at some examples, the first of which is the huge rebound bull move of 2009, when the Nasdaq advanced 44% following the brutal prior-year meltdown. You can see that the year after ended up being a good one overall (our Cabot Growth Investor portfolio was up 27%), but almost all of that occurred starting in September with names like Priceline, Las Vegas Sands (LVS) and Chipotle (CMG) going bananas. Before that, it was a tough road: The Nasdaq suffered the “flash crash” in early May, lived under its 40-week line for a large part of the summer and, four months after the top, was still about 18% off its highs.
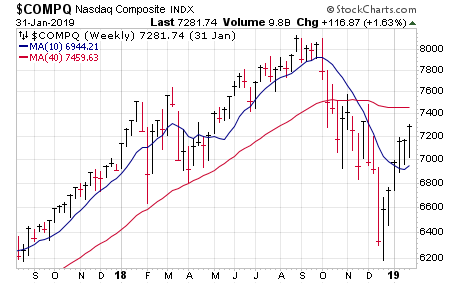
The aftereffects from the more-recent 2017 rally (Nasdaq up 28%) looked different, but still delivered two tough periods. After peaking in late January of 2018, the Nasdaq had a very sloppy 10%-plus correction for three months, and after another rally came the end-of-year, trade-war inspired 24% plunge, which finally gave way to an excellent 2019.
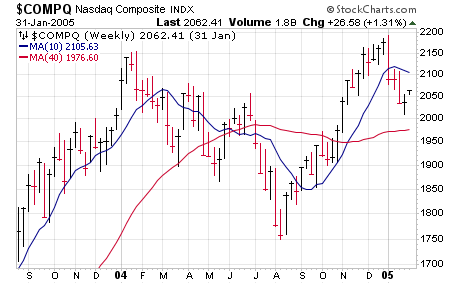
Before those two instances was the 2003 bear market recovery (Nasdaq up 50% after a 75%-plus decline the prior three years). Similar to the 2010 example, that led to a prolonged rough patch—the Nasdaq actually topped out in January 2004 and, while there were a couple of rally attempts, the index was sitting 19% off its highs about seven months after the peak. (The upmove after that didn’t get far into new high ground, but it was an excellent stretch—that’s when Apple (AAPL) and Google (GOOG) really began their mega-runs.)
Finally, further back was 1995, which saw the Nasdaq rally a huge 40%, though it did close the year with a few months of flat action. Still, after a strong rally into May 1996, the sellers showed up—the Nasdaq fell 19% from top to bottom and was still 10% off its highs three months from the peak while many speculative names back then (Iomega comes to mind) crashed 70% or more. However, starting in September, the buyers were back and the late-1990s bull market accelerated higher.
Of course, four examples are not the be-all and end-all of analysis, but the market is an odds game, and precedent analysis suggests (a) this year’s growth stock correction could go further both time-wise and price-wise, but (b) what we’re seeing is not unusual historically speaking. Even just looking at a year-long chart of the Nasdaq, the past three months doesn’t look horrible—more like a tedious correction and consolidation after a massive run.
Short term it’s anyone’s guess, but until we see some real damage, we view this tedious stretch as setting up the next major upleg.
Is Sentiment Finally Faltering?
As students of the market, one of our main worries of late has been that few investors are worried about anything. But that might finally be changing, though we’d like to see more worry seep into the average Joe’s thoughts.
The NAAIM Exposure Index (measures the invested levels of many funds) skidded to its lowest (least bullish) level since April 2020 this week. The AAII Sentiment Survey saw a similar move, with the percent of bulls coming in at 37% for two straight weeks, the lowest figures since last November’s blastoff.
We’re more focused on the primary price/volume/trend action of the market and leading stocks, but usually when a correction gets rolling for a while, it will often end when investors finally get discouraged (and often go along with a crystalizing piece of bad news). We’ve seen some improvement, though some more worry would present a higher-odds situation.
Where do you think the market is headed next? Have you changed your investing approach in the last few months?
*Editor’s Note: This post was excerpted from a recent issue of Cabot Growth Investor. To read the whole issue, click here.
[author_ad]
