October has lived up to its reputation this year as one of stock market horrors, with the major indexes breaking down and numerous leading stocks (and many non-leading stocks) melting down. In lieu of a “regular” article, we decided to run through a quick Q&A with our growth stock and market timing guru Mike Cintolo—chief analyst of both Cabot Growth Investor and Cabot Top Ten Trader—to expand upon his Cabot Weekly Review Video from last week and give us his latest thoughts on the current market correction, some scenarios he’s thinking about going forward and some stocks and sectors where he’s beginning to notice resilience.
7 Market Correction Questions for Mike Cintolo
Q: Mike, let’s get right to it: The market, and especially growth stocks, have been hit very hard since October began. In the interest of full disclosure, what’s Cabot Growth Investor’s Model Portfolio looking like right now?
[text_ad use_post='129627']
A: We’ve taken our lumps and, as things began to fall apart—even before our market timing turned negative—we pared back relatively quickly, moving from 16% cash to 62% cash in a matter of eight trading days. Overall, the portfolio was still up 6.5% for the year coming into this week, which is obviously down from two weeks ago, but isn’t the end of the world. And since the start of last year when growth stocks got going, we’re doing fine, about doubling the S&P 500’s total return. Farther back than that, we’ve outdone the S&P by 3% annually for nearly 12 years. But we’ve gotten whacked since October began, which is never fun.
Q: Fair enough. Now to the market itself—what do you make of this meltdown? Is it a market correction, a bear market, sector rotation …?
A: I’m not huge into labels, but I’m basically thinking of this as a market correction within a larger uptrend for a couple of reasons.
First, we really didn’t see any classic bear market warning signs before this drop—breadth was fine, and investor sentiment, if anything, was tame.
Second, as I mentioned in my last column, there are a few simple studies that portend higher prices down the road. For example, coming into October, the S&P 500 had risen six months in a row; back to 1950, that’s never marked a bull market top (in fact, it usually precedes slightly above-average returns going forward).
Now, I will say that our Cabot Trend Lines—our longer-term trend model—could turn negative this week if the market doesn’t rebound by Friday’s close. That’s not a death knell, but would add evidence that the correction could take some time. (More on that below.)
Still, my overall view is that 2018’s overall action is generally following the script of what happens in the years after a huge, smooth advance—namely, a lot of sloppy, up-and-down action, with some great ups and fearful downs, but net-net, the year mostly serves as a digestion phase for the next sustained leg up.
Q: I know you don’t predict, but what are your guesses for how long the market correction will last?
A: I would simply say that the ferocity and, after it got started, the breadth of the decline (stocks of all stripes broke their intermediate-term uptrends) strongly argues in favor of time being needed for the next round of leaders to build fresh launching pads. That could be a few weeks, or if things get uglier, a few months. But the odds are against an immediate snap back—not impossible, but unlikely.
Really, though, it’s not about predicting but just staying with the trend. We had no idea 2008 would turn into a disaster, but by following the market’s messages via our market timing indicators, we were 90% in cash before Lehman went under and the market really tanked.
To be clear, I really don’t foresee anything close to that happening, but I trade based on what I see, not guesses as to what the future holds. Hence, I’m sticking with a defensive stance here.
Q: What about the short-term, though—you mentioned you’ve seen some extremes?
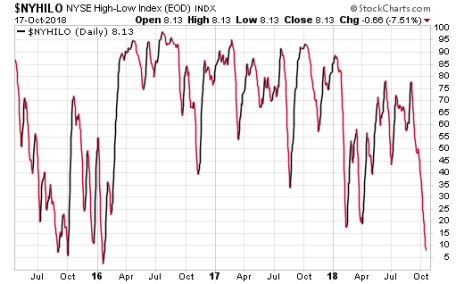
A: I have, though I want to emphasize we’re talking about short-term sentiment indicators, which are not anything I really trade off of. Still, you’re right—the two-week wipeout did offer up some near-term extremes, including monstrous trading volume among ETFs and inverse ETFs (a sign of hedging demand), a plunge in investment levels among active managers and, this week, an extreme among new highs and new lows.
As you can see in the chart below, the NYSE Hi-Lo Index (number of stocks hitting new highs divided by the number hitting new highs plus new lows) has dropped to 8%, the lowest level since early 2016 and one of the handful of lowest readings going back to 1995.
None of these are precise timing tools by any means, but it does raise the odds we’ll see some rebound, whether it’s right now or after a bit more weakness. We’ll see. I would say, following any rebound, the odds favor some sort of re-test or another leg down, but I’ll take it as it comes.
Q: What about individual stocks? Some of the popular leaders of this advance have seen 20% to 25% haircuts—are there any buys here? Will they be later?
A: I’m not advising much buying here, though some nibbles here or there (if you have plenty of cash on the sideline) is fine.
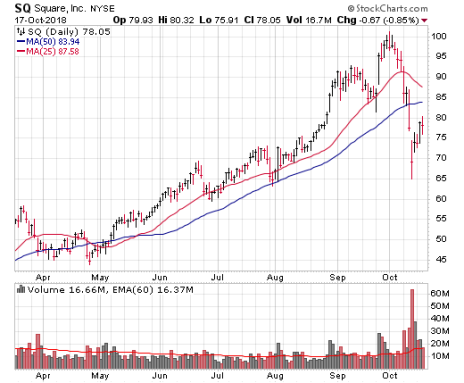
For the intermediate-term, buying depends on the situation. In my video last week, I talked a bit about Square (SQ), which has been a great, great stock. But after breaking out around 15 in February 2017 from a post-IPO base, shares ran to 101 over the next 19 months before its recent 35% plunge.
Am I saying the stock has topped out for good? No, but after such a long run and sharp dip, SQ almost surely needs time to consolidate for at least a few weeks, if not longer.
However, other names that are either “fresher” (just broke out from big bases a few months ago, as opposed to a year or two ago) and/or have held up well, those could be ready to get going sooner.
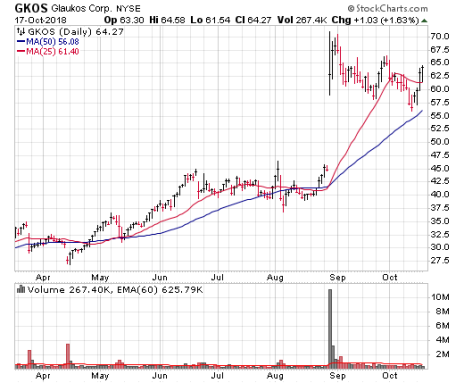
An example would be Glaukos (GKOS), which already went through the wringer in recent years, meaning most weak hands have already been worn out. The stock gapped up huge in August (after a competitor basically threw in the towel) and, while GKOS has pulled back since, it’s been relatively controlled.
If things go right, it could theoretically pop within a few weeks, but obviously the overall market (and its next quarterly report) will have a lot to do with that.
Many commodity stocks are in similar boats—oil stocks, for instance, have only recently shown strength, meaning many weak hands are already out. If things go well, these are the types of names that could get going once the pressure comes off the general market.
Q: Beyond just the depth of the market correction and length of the prior uptrend, what other early signs are you looking for to identify potential new leaders?
A: Let me first say that a lot of good “feedback” will come during earnings season—obviously stocks that react well to earnings and hold those gains will be candidates for higher prices when the bulls return.
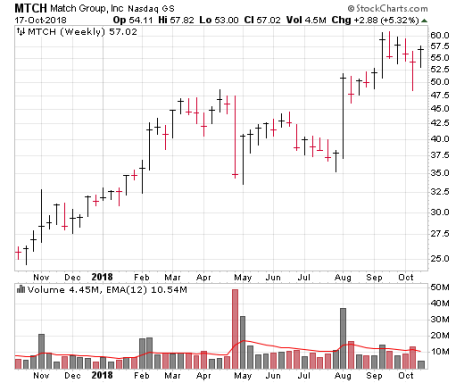
In the meantime, I’m looking for supporting action in two ways. The first is, on a weekly chart, looking for a pickup in trading volume and a weekly close in the upper half of the range.
Look at Match.com (MTCH), for instance, which broke out from a base in early August and ran as high as 61 last month. It’s since gotten hit with everything else, but notice how last week it closed nearly unchanged on the week, near the top of its range, on good volume. It’s a first sign that big investors were supporting the stock on dips.
The other thing to watch in the near term—again, these are shorter-term things given that we’re just three weeks into this decline—is going to be positive divergences in price compared to the indexes. In other words, let’s say the Nasdaq falls to a new low for a few days in a week or two, but stock XYZ holds above last week’s low. That would be a small sign of support worth flagging.
Q: Last question: You’ve mentioned recently that, while the overall bull market is intact, you wouldn’t be shocked to see this downturn represent the end of one phase of the bull market and, eventually, the start of a new phase. Do you want to expand on that?
A: Well, it mainly has to do with leadership. In my view, this bull market kicked off in November 2016, and while the first few weeks saw violent movement among cyclical stocks, the real action from the start of 2017 through August of this year (20 months) was in growth stocks. There have been some amazing runs!
Now, though, I have to say that some of these winners that have had extended runs are showing not just short-term selling pressure but possible abnormal longer-term action. Again, I’m not predicting anything, and I’m certainly not saying there will be no growth stocks doing well during the market’s next uptrend. But it could be more selective.
And I’m keeping an open mind that many areas which have struggled—financials, commodities, industrials—could offer up some leadership going forward. That doesn’t mean that I, as a growth stock guy, am going to have a portfolio full of cyclical stocks, but there are some intriguing growth stories within these areas.
As always, if the right combination of story, numbers and chart appear I’ll be featuring those stocks in Cabot Growth Investor advisory.
[author_ad use_post='125412']


