All of a sudden, market volatility is back.
After being in the 10-to-13 range since the calendar flipped to 2017, the Volatility S&P 500 (VIX) spiked to the high 15s this week, its highest point since Election Day. The VIX is a measure of Wall Street uncertainty, which is why it’s also known as the “investor fear gauge.” And right now there’s more fear on Wall Street than there has been since Donald Trump won the election.
Last month’s failed TrumpCare vote likely contributed to the uncertainty, as some investors viewed it as a sign that his other big-ticket initiatives—namely corporate tax cuts—might meet similar roadblocks. The bigger catalyst may be the situation in Syria, as much of the spike has come since President Trump gave the executive order to bomb a Syrian airfield in response to a vicious chemical attack that killed Syrian civilians, including children.
But sagging investor sentiment is part of the equation too. Only 29% of analysts are bullish right now, a 2017 low. Whether that’s due to concerns over Syria, Trump’s policies, the latest Fed rate hike or stocks’ high valuations is unclear. What is clear is that there is some real concern on Wall Street for the first time in more than five months.
[text_ad]
Stocks have actually fallen in the last month, though less than 1%. The S&P 500 is down 2.1% since peaking at 2,395 on March 1. But let’s put the current decline in its proper context.
A 2% decline isn’t reason to panic, especially not when the starting point was a record high.
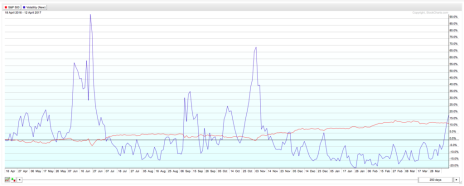
For further solace, look at this chart of the VIX and S&P 500 over the past 250 trading days, a full year.
You’ll notice that the VIX has had some wild swings in the past 12 months, spiking as much as 70% after the Brexit vote last June and 65% right before the U.S. election in November. The most stocks fell amid those big jumps in market volatility was 5%. And each time, stocks took only a few days to recover before motoring higher than before.
So, this latest volatility-driven mini-dip could be temporary—at least if it follows the pattern of the last year. And though the VIX is at its highest level since the election, it’s still pretty low compared to the spikes in November (to 22.5), September (to 18) and last June (to 25). None of those VIX spikes lasted very long—in each case, the VIX was lower than it was pre-spike within a month.
The latest escalation in stock market volatility is only about 10 days old. Give it a couple more weeks. If the VIX isn’t back below 13 by, say, the end of April, then it might time to start selling stocks. Right now, this looks like another passing storm, similar to others we’ve seen since the Brexit vote.
What makes this storm seem a bit more ominous is how long it’s been since we’ve had a volatile market. But even the most ominous looking storm can pass without doing much damage.
Recent market history tells us the damage will again be minimal this time around. Stay tuned.
[author_ad]

