History doesn’t repeat, but it does often rhyme—and the same can be said of stock market history. To that end, we’ve been trying to come up with the closest historical comparison to the current coronavirus crash, and we’ve kept coming back to the 1987 market crash as the answer.
But the truth is, nothing in the history of the stock market quite resembles the current crash in terms of speed—not the initial crash, and not the instant recovery.
[text_ad]
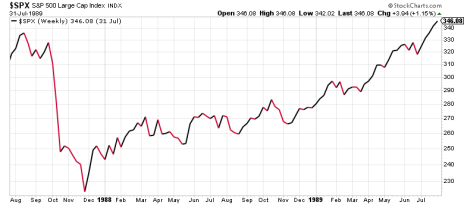
Let’s look at a two-year chart of the 1987 stock market crash, starting with the August 1987 market peak and going through the full recovery in mid-1989:
That sudden market nosedive centered around the infamous Black Monday crash on October 19, 1987, in which the S&P fell 22% in just one trading day—still the worst one-day decline on a percentage basis in stock market history. The S&P had topped out two months earlier, but Black Monday accelerated the losses in a way similar to how the first three weeks this March accounted for the worst of the current market crash. From top to bottom in 1987, stocks fell 33.5% in about three and a half months, with the bottom coming in early December—about six weeks after Black Monday.
Today, we’re two full months into the current crash, but the bottom appears to have occurred on March 23 – just five weeks after the crash began. At that market bottom, the losses (-33.9% in the S&P 500) were almost identical to those in the 1987 crash. But the speed was even faster, occurring in less than half the time it took for the 1987 crash to go from peak to trough.
Already, stocks have recovered more than half those losses, turning our Cabot Tides intermediate-term market timing indicator positive at the end of last week (before stocks fell on Monday). After the 1987 market crash, it took the S&P almost a full year to recover half its losses.
As our resident market expert Mike Cintolo wrote in this space a couple weeks ago, pre-test recoveries after major market crashes are typically in the 40% to 55% range. After that, stocks typically fall again, re-testing their initial lows and forming a double bottom. Could that happen again this time? Perhaps. That might even be the most likely scenario, especially given that the coronavirus is still wreaking havoc on the global economy and the death toll has yet to slow in a meaningful way, at least in America.
And sure enough, the S&P’s recovery topped out last Friday at the very top of Mike’s 40% to 55% range, right at 55%, before falling on Monday. So this recovery is still in what would historically be considered a “normal” recovery phase, even though the speed with which it has happened has been abnormal.
Unprecedented Week in Stock Market History?
That makes this week critical. If the S&P shakes off Monday’s losses as little more than a blip, and continues to move higher, there may be no re-test after all. Stocks are bound to be volatile for some time, at least until parts of the global economy re-open and the number of coronavirus cases falls dramatically. But the worst may be definitively behind us.
That said, I’ll go back to what I wrote at the beginning: this crash and immediate recovery have no real precedent in stock market history. Thus, there’s no exact template to work off of when trying to predict what will happen next.
As Mike is fond of saying, just go with the evidence in front of you, pay attention to the charts, and take your cues from the market. It’s OK to come out from under your bunker now and do some buying. In a few weeks, you may have to duck for cover again … or, stocks could be higher still, and you’ll be very happy you bought.
It makes sense to wait things out if you think the worst is yet to come. But the evidence is increasingly suggesting that the worst—at least in stock market terms—may mercifully be behind us already.
[author_ad]


