Equity investors, especially those who follow growth stocks, know that bad news can be good news and vice versa. Which is why it’s so important to pay attention to stock market timing indicators and tune out the market “noise.”
That’s because bear markets persist until investors give up and sell their stocks. When the last investors finally make that sell order, markets can start to turn up.
By that same token, bull markets climb a “wall of worry” and can look overbought long before the bull market ends its run.
Those are facts.
[text_ad]
Markets are always going up and down, and if you have a way to distinguish a real market move from random motion, you can be back in the market before most investors know that the bull is back in town (or out of the market before the bull run ends).
Cabot’s best market timing indicators are Cabot Trend Lines and Cabot Tides (at Cabot Growth Investor, we follow these very closely when making our investing decisions).
What follows is a synopsis of each:
Market Timing Indicator #1: Cabot Trend Lines
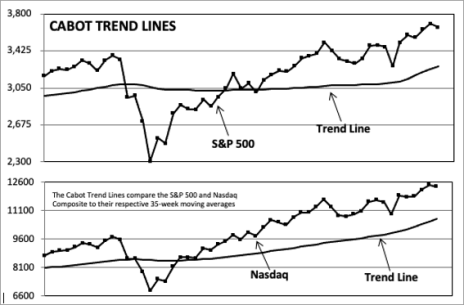
The Cabot Trend Lines are our unique way of determining the long-term trend of the stock market. As long as both the S&P 500 and the Nasdaq Composite fluctuate above their respective trend lines, we consider the market to be bullish. If both indexes are below their trend lines, we are in a bear market.
We used to employ a more complicated approach, but in 2012 we did extensive back-testing and found that using the 35-week moving average for each index worked best. Basically, if both indexes close two straight weeks above their respective 35-week lines, it’s a buy signal; if both close two straight weeks below them, it’s a sell signal. Using such a long-term moving average won’t result in pinpoint signals, but that’s the point—it keeps you on the right side of the major trend.
Of course, this isn’t meant to be a trading indicator, per se (though if you did use it for buy and sell signals it would usually keep you ahead of the market). Instead, though, the real value is that it keeps you leaning optimistic for the vast majority of bull markets while keeping you mostly out of the vast majority of any prolonged downturn.
For instance, on the bear side, the Trend Lines were negative for all but two months from early October 2000 to April 2003 (when the Internet bubble burst, along with Enron and 9/11), while they turned negative in early January 2008 and stayed that way through May 2009. The trend lines also helped Cabot Growth Investor largely avoid the 2022 growth stock sell-off.
Conversely, the Trend Lines have regularly stayed positive for a year or more during major uptrends in 2003-2004, 2009-2010, 2013-2014 and 2016-2018, keeping you heavily invested despite numerous tests and shakeouts along the way.
Right now, our Trend Lines are bullish.
Market Timing Indicator #2: Cabot Tides
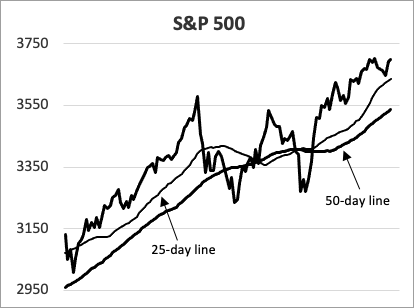
Our Cabot Tides is made up of five different market indexes to help us determine the overall intermediate-term direction of the stock market. They are: S&P 500, NYSE Composite, Nasdaq Composite, S&P 600 SmallCap and the S&P MidCap 400. We compare each index to its respective 25-day and 50-day simple moving averages.
The market is considered to be advancing on an intermediate-term basis if at least three of these five indexes are (a) above the lower of its two moving averages, and (b) that moving average is advancing. Conversely, if at least three of the five indexes slice decisively below the lower of their two moving averages, that triggers a sell signal.
The most important advantage of using this moving average approach in timing the market is that you are guaranteed to catch every major market advance while avoiding every major market decline. This is the nature of a moving average.
But there are a couple of costs, including the opportunity lost in the first few weeks of a new advance, as well as the small penalty you must pay for getting out of the market quickly when the market changes its mind soon after a new buy signal is given (known as a whipsaw).
For example, a new buy signal could quickly turn into a sell signal if the market turned weak enough to drop the index below its lower moving average. If that happens, you should quickly turn defensive again and start thinking about the preservation of your capital instead of trying to make big gains in a falling market.
Our Cabot Tides are also bullish, but it’s very mixed—broader indexes (like the NYSE Composite) are in solid uptrends, though the big-cap measures are mostly sideways (at or below their late-October highs). Still, with three of the five indexes above their lower (50-day), rising moving averages, the market’s overall intermediate-term trend is pointed higher.
Obviously, with the volatility that’s out there, the Tides’ stance could change at any time—but we always write, we don’t anticipate signals, so you should continue to give the bulls the benefit of the doubt.
Taken together, though, the Trend Lines and Tides have stood the test of time—while millions of investors have struggled with bubbles popping, the financial crisis, zero interest rates and quantitative easing, $100 oil and the pandemic, these rubber-meets-the-road indicators (along with the action of leading growth stocks) always keep us positioned to have the wind at our backs.
Using the Cabot Trend Lines and Cabot Tides market timing indicators, Mike Cintolo, Chief Analyst of Cabot Growth Investor, has been named one of the Top Ten Timers by Timer Digest.
At Cabot Growth Investor, we rely on our market timing indicators all the time when we make our investing decisions. That is how we were able to double our readers’ money multiple times throughout the years and grab a 270% profit in Beechcraft, a 173% gain in WD-40, a 240% gain in MCI Communications, a 122% profit in Triangle Industries and a 296% gain in TASER, just to name a few. Of course, past results don’t guarantee future returns, but if you are looking for Wall Street’s best growth advisory, Cabot Growth Investor is the one you should check out now. Click here to find out more.
[author_ad]
*This post is periodically updated.


