There’s no real precedent for what’s happening in the world right now. But a few market rallies have looked similar. Here are three from history that jump out.
As we’ve written a couple of times recently, we’re not leaning too much on precedent analysis in this environment because there just aren’t a lot of “pandemic playbooks” to go off of. Plus, while we don’t get too into the economic weeds, it’s a fact that the policy response (both via government spending/stimulus and from the Fed) is wholly unique. That’s why we think staying flexible is really the best thing you can do for your portfolio in 2020.
All that said, one thing we’ve been looking at is past initial market rallies after harrowing declines, be them long bear phases or sharp crash-like meltdowns. The question we wanted to answer was how long these market rallies lasted before the sellers finally put up a real fight. To make it straightforward, we looked at how long the rally went on—from the first week off the bottom to the last up week—before the market broke its 10-week line (even if it was for a brief time).
3 Post-Crash Market Rallies that Compare
First we have 1987, which brought a market crash somewhat similar to this year’s March debacle. After a retest in December, the Nasdaq kited higher for 15 weeks before settling down in March 1988, which ended up being the start of a three-month rest.
[text_ad use_post='129627']
Moving on to 2003, the S&P 500 rallied strongly from its March retest for 15 weeks before starting a sideways phase that briefly cracked the 10-week line. After the next big bear market in 2009, the initial rally lasted 14 weeks before a four-week correction took the market below the 10-week.
And even in 2011, which had a summer meltdown and was trickier to interpret, the rally that began in December (once the bottom process was complete) lasted 15 weeks before a meaningful correction.
To be sure, there are exceptions—when the 1982 blastoff came, the market didn’t break the 10-week line for 10 months! And even during the above examples, different indexes acted stronger or weaker; in 2003, for instance, the Nasdaq went about 19 weeks before a real downturn.
Nevertheless, a few things stand out when looking at these examples: First, these initial market rallies tend to last 14 to 15 weeks, which is right about where we are now; the current advance entered its 17th week on Monday. Second, of course, these dips took the market below its 10-week line, which is currently at 9,850 and rising.
Third, and most important, none of these market rallies marked major tops—there was some pain (usually for four to eight weeks) for sure, but the bull moves picked up steam afterwards. These precedents are worth keeping in mind as the Nasdaq and growth stocks finally hit a meaningful pothole this week.
Higher Prices Likely Ahead
Playing off that very last theme, probably the most bullish thing we see out in the market today from a big-picture perspective is that so many stocks either (a) are recent IPOs in the past year or two that staged their initial breakouts in April and May, or (b) are names that had good runs in 2018 and early 2019, but had enough down action (even before the crash) to generally “reset” their overall advance.
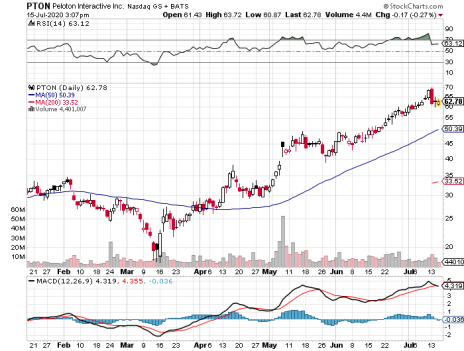
In other words, many names look to be early-stage, meaning in the first half of their overall advances. For example, look at Peloton (PTON), which just came public last September and shaped a nice IPO base from December through April before breaking out and having a huge run.
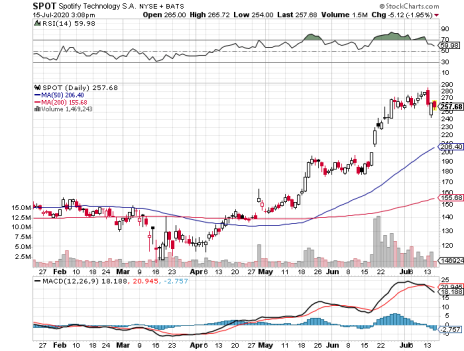
Spotify (SPOT), which I’ve written about before, is another example, with a longer 20-month post-IPO base before blasting off in May and June.
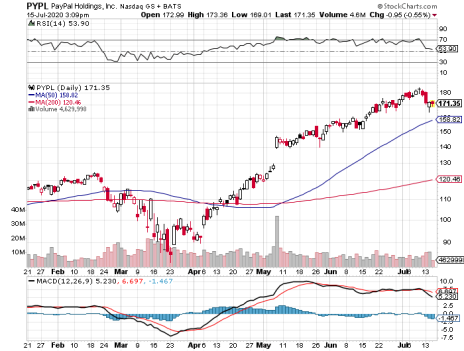
Then there are names like PayPal (PYPL)—in this case, the stock had a solid advance over a couple of years, but then had two big corrections over a nine- to 10-month period, the first being tedious and the second knifing lower during the market crash … action that likely scared out the remaining weak hands.
Of course, there are never any sure things; maybe PYPL and PTON will get crushed on earnings this month and won’t be heard from again. But the market is an odds game, and given the positive longer-term vibes from our market timing indicators (Cabot Trend Lines, 90% Blastoff Indicator, etc.) and the early-stage nature of many leaders, the odds are that any hesitation in these stocks should give way to higher prices down the road.
If you want to know what other stocks I like now, and to learn more about the market timing indicators I just mentioned, you can subscribe to my Cabot Growth Investor advisory by clicking here.
Editor’s Note: This post was excerpted from the latest issue of Cabot Growth Investor.
[author_ad]


