Exchange-traded funds (ETFs) have witnessed a popularity explosion in recent years, and for good reason: they allow small investors to buy a piece of their favorite asset groups more cheaply and with less hassle than buying a traditional mutual fund. ETFs can also be used to track the progress of the leading S&P sectors and individual asset classes, which is why even professional traders and hedge fund managers have come to prefer them over individual stocks and commodities.
But what are the best ETFs on the market today? I’ll get to those in a minute.
[text_ad]
With the importance of ETFs expected to increase in the coming years, it’s essential for individual investors to regularly monitor the most actively traded sector and industry ETFs. Doing so can provide you with excellent clues as to what insiders and “smart money” professionals are doing with their money at certain times, which can be very useful during periods of heightened market volatility (such as we’ve lately experienced).
Which ETFs to Look For
With this in mind, let’s take a look at some of the valuable clues provided by several leading industry and sector ETFs. One way you can improve your batting average as an investor is to look for bargain opportunities after the broad market has experienced a huge decline. But how can we spot buying opportunities in a time when so many stocks have suffered so much damage?
One of the most important ways of identifying strong buy candidates is to look for ETFs whose price lines have shown a clear and conspicuous divergence from the benchmark indices, such as the S&P 500 Index (SPX). This simple trick is how many successful traders and investors choose winning stocks and ETFs after a market decline.
The key here is to look for signs that the seasoned market pros are accumulating (buying) stocks. In his book, The Secret of Selecting Stocks for Immediate and Substantial Gains, Larry Williams made this observation:
“To spot professional accumulation, all we need to do is find an example of steady and determined buying in the face of a weak stock market. When this happens, we have a good idea that professional buying is taking place.”
Another way of identifying how well an industry is performing versus the rest of the market is by using a relative performance (RP) line. This technique was developed many years ago by Carlton Lutts, founder of our Cabot Top Ten Trader momentum-investing advisory. He wrote:
“Relative performance (RP) is simply a measurement of how a stock is acting relative to the market as a whole. This can be measured mathematically, but we prefer a visual representation because we have found it easier to analyze. As they say, a picture is worth a thousand words.”
An RP line is basically the stock’s daily closing price divided by the daily closing price of the benchmark S&P 500 Index or another major index. It shows how the stock is behaving compared to the broad market, and as such, is a powerful tool that will give you a considerable advantage over the average investor. The RP line is simple to use; when it’s moving higher, it shows a stock is outperforming the broad stock market. When it’s declining, it shows the stock is underperforming. A steady, level RP line tells you the stock is performing roughly the same as the market.
By combining these two techniques, we now have two reliable ways of detecting accumulation (or informed buying) in an ETF:
Look for a bullish divergence between the market itself—using the Dow 30 or S&P 500 as a benchmark—and the ETF you’re examining. For instance, when the S&P has made a series of lower lows over a certain time period, and the ETF you’re watching has made a series of higher lows in that same period, you’ve just found an ETF that is likely being accumulated by the “smart money” crowd.
Watch for ETFs that are showing above-normal strength when compared to major indices like the S&P by using a relative performance line. You can easily spot an ETF’s relative performance by simply noticing if it has resisted declining in a period of broad market weakness. If it has shown strength compared to the S&P, it’s likely being held by “strong hands” or professionals. And it usually pays to follow the lead of the smart money crowd.
Let’s apply these basic principles to find the best ETFs based on their year-to-date performance relative to the S&P 500. For the purposes of this article, we’ve omitted leveraged and short ETFs as well as funds or ETNs that rely on futures contracts to replicate the performance of a sector or commodity. Even controlling for those factors, this list is heavily influenced by short-term trends and, as you’ll see below, very concentrated in one particular industry. We’ll begin with the sixth-best fund and work our way to the best performer.
The 6 Best ETFs by YTD Performance
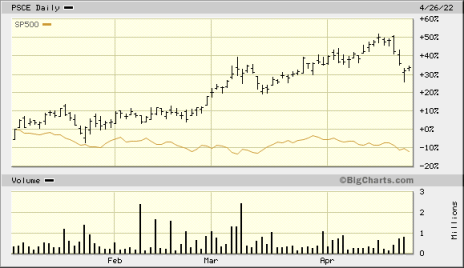
- First on our list is the Invesco S&P SmallCap Energy ETF (PSCE), which is a market-cap-weighted ETF that invests in small-cap energy companies “engaged in the business of producing, distributing or servicing energy related products, including oil and gas exploration and production, refining, oil services and pipelines.” The fund is up 34.6% YTD and has been trending higher since the pandemic bottom, although it’s down 82% from all-time highs reached in 2014. For this momentum to continue it will likely require sustained high energy prices.
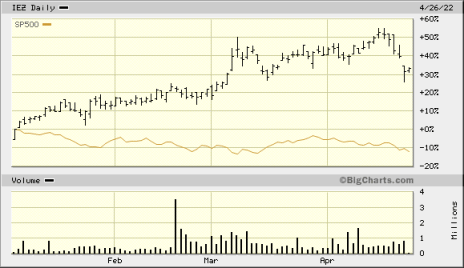
- Continuing on the energy theme is the iShares U.S. Oil Equipment & Services ETF (IEZ), which is a market-cap weighted domestic energy ETF. Those two factors make the fund highly reliant on the performance of Schlumberger (SLB) and Baker Hughes (BKR) which comprise over 44% of the total portfolio holdings. The fund is up 35.4% YTD and over 43% over the last 12 months. Like previous entry, this fund is down significantly over the last five years (52.8%), but would significantly outperform other entries on this list if the U.S. continues emphasizing domestic energy growth.
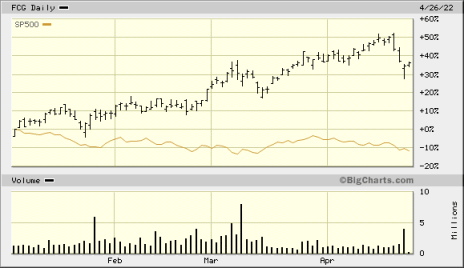
- Next up on our list is the First Trust Natural Gas ETF (FCG), which invests in U.S. stocks and companies involved in the exploration and production of natural gas, returned just over 36% YTD. The fund additionally screens for proven reserves will not invest in companies that do not meet the fund’s thresholds. Because liquidity is also a factor, the fund’s top holdings are predominantly well-known energy names.
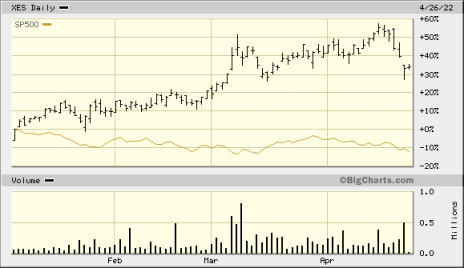
- The SPDR S&P Oil & Gas Equipment & Services ETF (XES), which is another energy services sub-sector fund, comes in third on our list. The major distinction between this and the other equipment and services fund (IEZ) is that this fund uses an equal-weight methodology rather than allocating investment dollars by market cap. The fund is up 36.4% so far this year.
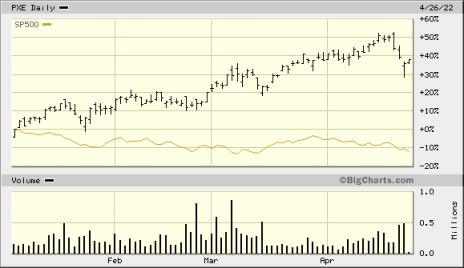
- Unsurprisingly perhaps, we’ll continue our list with another energy ETF, the Invesco Dynamic Energy Exploration and Production ETF (PXE). The fund is based on an index which comprises “30 U.S. companies involved in the exploration and production of natural resources used to produce energy.” The fund’s top three holdings are Occidental (OXY), Comstock Resources (CRK) and Valero (VLO), which represent 5.88%, 5% and 4.8% of the portfolio respectively. The fund is up 36.9% since the beginning of 2022.
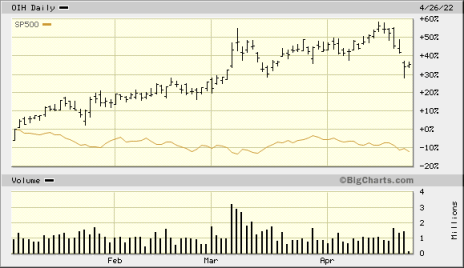
- The last entry on our list, and also the largest, is the VanEck Oil Services ETF (OIH), which tracks the performance of the 25 largest U.S.-listed oil service companies. This fund is also market-cap weighted and skews heavily towards Schlumberger (20% of the portfolio) but does have approximately 25% of assets under management invested in foreign companies that are cross-listed, or U.S. listed but headquartered outside of the U.S. The fund has returned 38% YTD and boasts one- and five-year returns comparable to the other entries.
Based strictly on relative performance, these are six of the best ETFs in the U.S. equity market right now. While past performance doesn’t guarantee future results, it usually pays to follow the path of the smart money traders and investors. And the ETFs discussed above appear to be among the favorites of this market-moving crowd.
If you want the best-performing growth stocks right now, I highly recommend subscribing to our Cabot Top Ten Trader advisory, where chief analyst Mike Cintolo provides you with a weekly update some of the market’s strongest growth stocks from both a technical and fundamental perspective.
To learn more, click here.
[author_ad]
*This post has been updated from an original version, published in 2020.
