Obviously, the big news of the week is the market itself, so I wanted to blast out a few guidelines, thoughts and historical comparisons of what I’m seeing now. As volatility spikes, so does emotion, and I’ve always found it useful to rely on history to have some idea of what’s likely (though, of course, every situation is different) after the recent, sudden stock market collapse.
Let’s get started.
My Roadmap to the Stock Market Collapse
- First, very big picture, it’s important to remember that the general market hasn’t had any sustained selling since the Presidential Election of 2016—that’s 15 months of just 2% to 3% corrections in the S&P 500. Such a long time without any pullback and with such heady gains brought investor sentiment to giddy levels last month—probably the most enthusiastic I’ve seen in 15 years or so. Given all that, an intermediate-term correction of some sort isn’t uncalled for or unusual.
[text_ad]
- So what comes next? Before I get to that, realize that what I am writing is a very rough roadmap—something that’s good to have, in my opinion, but shouldn’t be thought of as a crystal ball. OK? OK. Moving on.
- In the very, very short term (days), there have been a ton of extreme “oversold” readings that are good at forecasting a bounce. Those of you who subscribe to Cabot Growth Investor and Cabot Top Ten Trader (which I manage) know I’m not a big fan of overbought or oversold readings; I prefer trading with the trend. But whether you’re looking at spiking volatility, huge numbers of stocks hitting new lows or massive trading volume among market-based ETFs like SPY and QQQ, there are clearly signs of short-term panic (when people are worried about the market, they trade these ETFs; when they’re optimistic, they move to individual stocks).
- That said, in the “regular” short term (couple of weeks) to intermediate term (couple of months) timeframe, the odds favor more corrective and consolidative action going forward. Why? Mostly because it takes TIME for investors to get more worried (which is usually necessary for a sustained upmove), and it takes TIME for big investors to liquidate and/or reposition their portfolios. Don’t get me wrong—I’m not saying we’re in for six months of plunging prices. I just mean a spike from any coming near-term low all the way back to new highs would be highly unusual.
4a. I would say, as a small caveat, that the market has broken many historical precedents in recent years, so you shouldn’t rule anything out—maybe this is the one time out of 10 that the market falls sharply after a big run and bottoms out all within a couple of weeks. But I like to formulate my investing strategy based on the odds, and the chance that we have a two-week retreat and then go merrily on our way is pretty small.
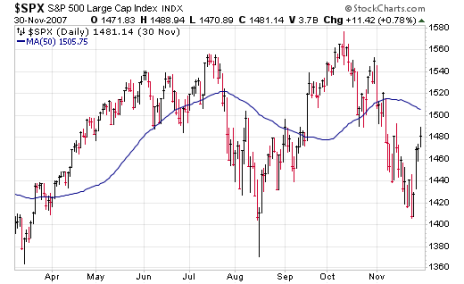
- The good news is that, long term (months down the road), there’s plenty of evidence that says the bull market is intact. Why? First, because major tops take time (at least a few months) to form, where momentum wanes and the underpinnings of the market falter. Even looking at a major top in 2007, the indexes fell sharply in the summer but retested their highs before rolling over.
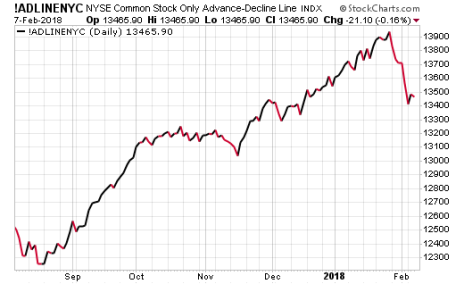
- Secondly, measures like breadth almost always peak months ahead of a bear market, which didn’t occur this time. Shown here is a chart of the NYSE Advance-Decline Line of common stocks—note how the line peaked in late-January with the major indexes, not months before.
- And third, there were many longer-term indicators and studies that flashed green during December and January. They rarely give signals, but when they do, they have a very good track record of forecasting higher prices six to 12 months ahead.
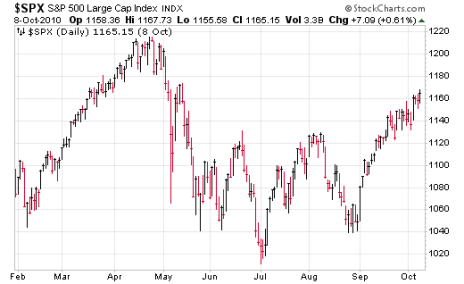
- OK, so if it’s not a bull market top, but it’s some sort of top, what scenario could we be looking at? One that pops into my mind is the 2010 “flash crash” market correction.
- After a big run in 2009 and early 2010, the market fell suddenly in April (the flash crash) and formed a low in the short term. But you can see that wasn’t “the” low—the indexes chopped lower for a few months before finally bottoming in August and embarking on a huge year-end run.
- Please don’t think that, because the 2010 downturn took five months and saw the S&P 500 fall 17%, this downturn will match those exact figures—history rhymes, it doesn’t repeat. (Plus, the 2009-2010 move was much sharper percentage-wise than the 2017 upmove.) It’s not about the exact percentages but the overall pattern—extreme short-term weakness after a huge run and elevated sentiment often leads to a bounce, but then some retest and/or lower lows. Longer term, though, the bull resumes.
- As for individual stocks, these kinds of stock market collapses, while never fun, are revealing—now’s a great time to see which stocks are holding up well. I also like to look for names that have only recently come out of consolidations (early stage). Two come to mind.
2 Growth Stocks in Good Shape
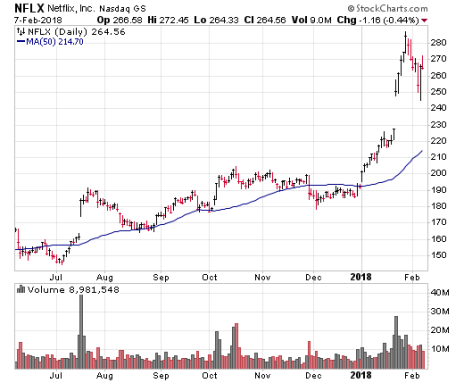
Netflix (NFLX), which spent the second half of 2017 going nowhere, blasted off when the calendar flipped and then soared on (and after) earnings. The pullback has been sharp, but you can see on the chart how it’s still in good shape.
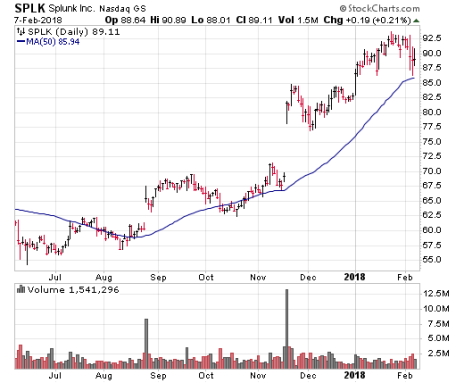
The other is a name I’ve mentioned before—Splunk (SPLK), which blasted off in November, paused in December, took off in January and has held very firm during the selloff. Earnings are out March 1, which is a risk, but the stock has all the makings of a winner, and so far, it’s clear big investors aren’t eager to dump shares.
That’s all for now—if you have any questions about the stock market collapse, feel free to shoot me an email. And if you want all of my advice (including what to sell, what stocks to watch and when to buy), give my Cabot Growth Investor a try—our market timing and stock selection system (along with four decades of know-how) gets us through these tough environments and into the leaders of the next upmove—it’s the reason we’ve easily beaten the market over the past 11 years.
[author_ad]

