Forget about the still-uncertain election results for a few minutes. Let’s talk stocks. Specifically, let’s talk about a few encouraging historical signs of bullishness - and one rare seasonal market indicator that’s happening now.
The tide is going out for the market and (more important) for leading stocks, which is why we’re sitting with a good-sized cash position in our Cabot Growth Investor advisory; in fact, we’re borderline defensive given the numerous failed breakouts and unrelenting drops in so many growth stocks. On an intermediate-term basis, this has been the second batch of abnormal selling since the top in early September.
However, on a longer-term basis, the post-August action looks normal and isn’t out of character for what the market often does following (a) a big downturn and (b) the initial, multi-month rally. The examples are numerous.
[text_ad use_post='129627']
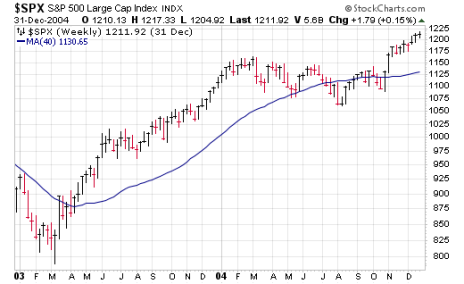
Take the 2003 rally after the tech bubble/9-11/Enron bear market the prior three years. Given the length of the bear market, the rally was a long one (10 months), and that led to a long rest period the following year (about five months). But notice how the decline really didn’t take back much of the prior bull move—and, of course, the next major move came on the upside.
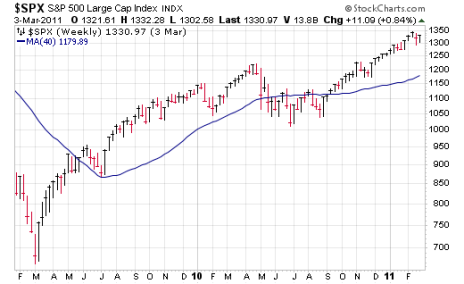
It was a similar story coming out of the 2008-2009 debacle—again, because of the length and severity of the decline, the ensuing rally was a long one (13 months) and was followed by a four-month downturn before the bulls reasserted themselves.
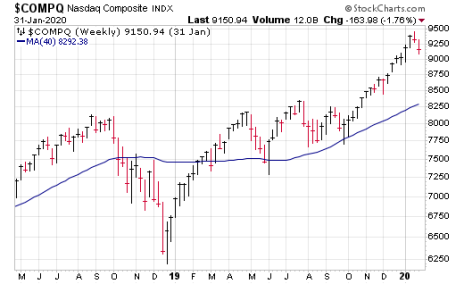
Even in 2018, which sported a more “normal” downturn (20% or so on the major indexes over three months), the rally that followed lasted four months and was followed by five months of choppy action before the pre-pandemic run got underway.
Bringing it back to this year, we saw a five-plus month advance off the March lows, and so far, a two-month rest that’s featured a couple tough corrections (10% in September, and another 8% dip in October). But like the other examples, the vicious swings haven’t taken back much of the prior rally, making the action look normal in the big picture.
Of course, that doesn’t mean this correction can’t get deeper or last longer from here—in fact, we’d probably bet on that happening given the recent damage. But, while anything is possible (this is 2020!), it would be highly unusual to see a “follow-on” major decline after the one we just experienced in March. We still expect the market’s next big, sustained move to be on the upside.
A Bullish Seasonal Market Indicator
We’ve never been huge fans of using the calendar for investments—yes, the summer can often be slow, and the winter is usually good, but such things are broad averages and the market can go against the “norm” in a big way. Heck, the last two big market declines (October through December 2018, and February-March of this year) occurred during so-called favorable seasonal periods. Simply put, if making money were as easy as following the calendar, we’d all be rich, but that’s not how the market works.
However, as with many things in the market, when the unusual occurs, it’s often telling. And such a situation just occurred. It starts with understanding the so-called best and worst six months of the year—historically, the market has made the vast majority of its gains in the November through April period of time, while, net-net, May through October has provided little upside. (Hence the saying, “Sell in May and go away.”) What’s interesting though, is when the market has great gains for the “worst six months” (May through October), it has a great history of portending further gains.
This year, for instance, despite the sour end to last month, the Dow Industrials were up 8.8% from May through October. That was just the 12th time since 1950 the Dow gained at least 8% in that “worst six month” period—in the prior 11 instances, the Dow went on to gain over the next six months (the “best six months”) every time, and by an average of 14%! The theory makes sense—if the market can post an outsized gain in a bad seasonal period, it should do well when the bulls often run wild.
Again, this is no reason to ignore the selling we saw last week. But the way we look at it, this seasonal market indicator confirms the big-picture view we mentioned above—near-term, the market has issues to work through, but this is still a bull market, so the odds continue to favor higher prices when looking months ahead.
*Editor’s Note: This post was excerpted from the most recent issue of Cabot Growth Investor.
[author_ad]


