Sell in May and Go Away is a stock market axiom that goes back nearly 70 years. It’s a market timing tool that says you should sell your stocks in May and don’t buy back in again until November. And the numbers back it up. Or at least they used to.
According to my trusty Stock Trader’s Almanac, the average return in the Dow Jones Industrial from May through October since 1950 has been a mere 0.3%. The average return from November through April is 7.6%. That’s a pretty substantial difference—and the reason some investors adhere to, or are at least aware of, the Sell in May phenomenon.
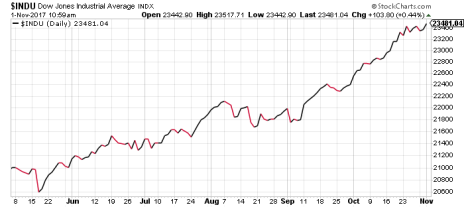
Hopefully those people didn’t sell their stocks this May! This year, the market’s alleged “worst six months” produced a 12% return in the Dow, a 10.6% return in the Nasdaq and an 8.3% return in the S&P 500. If you sold off a portion of your portfolio in May and buried your head in the sand until now, chances are you missed out on a few double-digit profits, as the six-month Dow chart below shows.
It’s not the first time the whole Sell-in-May-Go-Away theory has fallen flat in recent years. From May through October, the Dow has actually been up in four of the last five years, the first stretch like that since the mid-1990s. That’s no coincidence; the mid-to-late 1990s was one of the great bull markets in history, with two of the three longest stretches without a stock market correction of at least 5%.
[text_ad]
As I wrote yesterday, right now we’re in the midst of the fourth-longest correction-free streak in history, with the S&P 500 at 337 days and counting since the last pullback of at least 5%, in January 2016. The takeaway? When there’s a bull market like this one, throw seasonality out the window. Stocks have been trending upward with very little letup since January 2016. As a result, the Sell in May strategy hasn’t worked out this year.
The flip side of the erosion of traditional seasonality is that the market will be hard-pressed to match its 7.6% average return over the next six months. With stocks at all-time highs, valuations at decade-highs, and no corrections in nearly two years, a pullback is inevitable. Chances are it will happen sometime in the next six months. And that could mean the market’s “best six months” won’t be so great.
Bottom line: with stocks rising through two straight winters, springs, summers and now a second straight fall, there’s no point in paying attention to the calendar when making an investing decision. The current earnings season, GDP growth, jobs data, upcoming holiday shopping season—those are the things that will truly determine how long this bull market lasts. If they continue to be positive, Wall Street won’t care what month it is.
If they fall short? Then you might want to sell a few stocks earlier than next May.
[author_ad]

