There’s almost no precedent for what we saw in March of 2020. Sure, stock market crashes happen every few years, give or take. But 30% in less than a month? That’s rare. How rare? We had to dig back far into the stock market history archives for the nearest parallels: 1962 and 1987. Let’s look at them both.
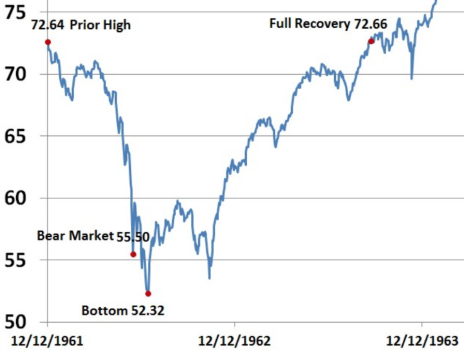
Here is a chart of the 1962 market crash, from top to bottom and back again:
This chart, courtesy of Marotta Wealth Management, shows the S&P 500 crash that began on December 12, 1961, and bottomed on June 26, 1962—a 28% decline in roughly six and a half months, though the vast majority of the decline occurred over just a few weeks. From that bottom, it took just over 14 months for the market to fully recover. However, the bottom itself only lasted about five months, as stocks really got going to the upside after a re-test of the low that October when the Cuban Missile Crisis occurred.
[text_ad]
The pandemic crash, of course, surpassed the 1962 decline in terms of depth and speed, down 34% at its nadir, on March 23. So, perhaps the 1987 crash is a better parallel. Let’s look at the chart first:
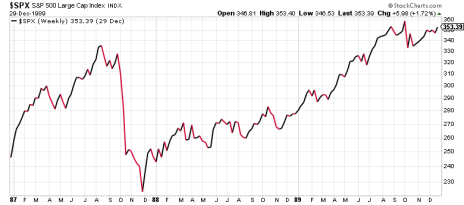
That sudden market nosedive centered around the infamous Black Monday crash on October 19, 1987, in which the S&P fell 22% in just one trading day—still the worst one-day decline on a percentage basis in stock market history. The S&P had topped out two months earlier, but Black Monday accelerated the losses in a similar way to how the first three weeks of March accounted for the worst of the current market crash. From top to bottom in 1987, stocks fell 33.5% in about three and a half months, with the bottom coming in early December—about six weeks after Black Monday.
As you can see from the chart, there was a decent bounce that December, as stocks rose 12.5% in three weeks. From there, the S&P traded in a range between 252 and 283 for all of 1988 before pushing to new all-time highs by the middle of 1989.
The bulk of the 1987 stock market crash took place in a two-month span, falling 32% from late September to late November. Typically, those types of losses occur over a longer, more drawn-out period. The worst of the 2008-09 subprime mortgage crash, for example, lasted nearly seven months, during which time the S&P plummeted more than 46%. But from start to finish, that global recession-fueled crash lasted roughly 17 months, the first 10 of which were more like a slow trickle before it became a full-on geyser in September 2008.
This coronavirus market pullback, of course, was anything but a trickle. It’s was a geyser from the start, with wild, record market swings on almost a daily basis for just over a month. Thus, it looks more like 1987 on a chart.
What really differentiates the pandemic crash from 1987 is the speed of the recovery. Once the S&P hit bottom it took only five months to return to previous levels, unlike the 1988-89 recovery, which took almost two years. And since that five-month rally, the S&P has returned over 40%.
In both historical bits of sordid stock market history I just mentioned, stocks took less than a year and a half to put in a firm bottom, before they started zooming upward again. History repeated itself with the pandemic market recovery although on a much-accelerated timescale.
The next time the market softens and starts looking ugly, let us guide you through the mess. We’ve seen it all in our 50 years in business, including the 1987 market crash, the 2008-09 recession and a once-in-a-lifetime (hopefully) pandemic. Through each downturn, we’ve helped prevent our readers from losing their shirts in the bad times, and made them a lot of money in the good times—which far outnumber the bad times.
Good times will come again. Even if it doesn’t feel like it in the moment.
[author_ad]
*This post has been updated from an original version.


