I have plenty of stock market thoughts today. And that’s not typically the case the week between Christmas and New Year’s.
Usually at this time of year I’m focused mostly on whether the Patriots have locked up the top seed for the playoffs (unlikely this year, though last week offered some hope), testing out some new cocktail recipes (I have found a new one for me—light rum, lime juice, Cointreau and some maraschino cherry juice; shake, pour over ice, add club soda, resulting in a nice, light pink color that tastes smooth) and chit-chatting with the in-laws.
But 2018 has flipped the script. Instead of a sleepy, upward-tilted market environment heading into year end, stocks are instead in the throes of one of their sharpest downturns in decades. And then this week saw the first-ever 1,000-point Dow rally! Thankfully, our market timing indicators have helped us avoid a good chunk of the damage—more on that in a second—but there’s no question the recent action has left investors wondering what’s up.
So I figured if there was ever a good time to give a run-through of my stock market thoughts as the calendar flips, it’s now.
[text_ad]
9 Stock Market Thoughts
1. First off, I know there’s a ton of dramatic headlines and blame game going on now, but just remember in the market, it’s often best to keep it simple. Here’s a tweet I sent last week (you can follow me on Twitter @MikeCintolo):
“Always amazes me how simpler is better in the market. Our long-term trend model (we call it Cabot Trend Lines), which is based on weekly closes of the S&P 500 and Nasdaq vs. one simple moving average, has outperformed the Nasdaq by 2.4x since late 2000, and ~2x for S&P … our Cabot Trend Lines turned bullish in mid-April 2016, were bullish for 2.5 years straight (!), then turned bearish on October 19. That signal (and others) was big reason why we’ve averaged being three-quarters in cash in Cabot Growth Investor for the past couple of months.”
That’s not to say the Trend Lines are perfect by any means; no indicator is. But the point is that, despite the desire from so many to dive into the minutiae of market news and rumors, just sticking with the trend often provides better results.
2. That said, while I’m a trend follower first, second and third, that doesn’t mean I leave my brain at the door when it comes to secondary indicators. And recently, I’ve seen a deluge of oversold and pessimistic sentiment readings that, historically, have occurred near major market bottoms. Recent examples:
- The 10-day moving average of the ratio of new highs to new lows on the Nasdaq has dipped below 3% (i.e., there were 100 new lows for every three new highs every day for the prior 10 trading days). Prior times this indicator has gotten this oversold since 1980 include January 2016, October 2008, September 1998, October 1990 and October 1987.
- Two weeks ago we saw a whopping $46.2 billion yanked out of equity funds and ETFs, which represented 0.44% of all fund assets—the largest figure in 15 years. (Hat tip to Jason Goepfert of Sundial Capital Research for that stat.)
- The VIX fear index recently leapt above 35 for the first time in months. Looking back, there have been 15 times since 1990 that the VIX has gotten that high; three months later, the S&P 500 averages a gain of 6%.
And those are just three of many extreme market-wide readings that have popped up in recent days.
3. How do I interpret such data? Simply that the market is likely near its point of peak downside momentum—the point in time when the broad market is weakest, when everything is getting thrown overboard. Given the huge Wednesday rally, it’s possible that peak in downside momentum occurred on Christmas Eve, but we’ll see.
4. However, even if we’ve seen it, a peak in downside momentum doesn’t equal “buy signal,” but it does usually mark the beginning of an attempted bottoming process—a process that could take the indexes lower even as more and more stocks and sectors begin to resist the decline.
For instance, did you know the peak in downside momentum during the 2008-2009 decline actually occurred in October 2008? On the 10th of that month, 1,514 stocks on the Nasdaq hit new lows. A month later, the figure was “only” 1,158. And at the generational low in March 2009, the figure had shrunk to 567—a sign the broad market was resisting while the major indexes fell.
A more recent (and probably better) example was seen in 2015, another year that had a sudden drop in a short time (18% on the Nasdaq in about five weeks), a massive surge in new lows, and then a bottoming process. The point is that buying at the point of peak downside momentum often isn’t fruitful.
5. Another thing these peaks of downside momentum tend to represent is the end of the “throw everything overboard” phase. During the past few weeks, stocks that have shown relative strength have tended to simply attract sellers as the bears rotated to resilient names. Going forward, though, my guess is relative strength will be a key to identifying new market leaders from here.
6. Put it together and the ideal scenario for the market going forward is: The indexes put in a short-term bottom soon (or already have on Monday) and stage a solid rally that lasts for at least two or three weeks (the longer the better). Then a bottom is etched over a few weeks or more, with possible retests of the lows even as newer, vibrant growth stocks resist and form solid launching pads. Strength after that would produce some quick buy signals from our market timing indicators and allow us to get in early. Again, that’s ideal.
Down the road, if this scenario does occur, I’ll be looking for some “blastoff” indicators to flash that will confirm a sustained uptrend. But it’s too early to go there today.
On the flip side, I would say that, given the historic oversold/pessimistic extremes mentioned above, if the market can’t find support soon (if Wednesday’s rally disappears in a few days), that would be a big worry for me—increasing the likelihood that something has come loose in the system behind the scenes.
7. “But Mike, I want to short. Do you have any recommendations for that?” Honestly, I’m not a big short-side player, because the big money isn’t in capturing a 10% or 20% selloff in a stock. But if you’re looking to short, it’s probably best to (a) look for names that haven’t already imploded 40% or 50%, and (b) wait for a bounce of two or three weeks and try to short after a rally failure. This goes for either stocks or index-based ETFs.
8. What if you’ve been patiently waiting in mostly cash but want to put a little money to work (assuming the market finds some support soon)? I’d probably hone in on some index ETFs, or look for growth stocks that, even after the latest wipeout, remain well above their October/November lows.
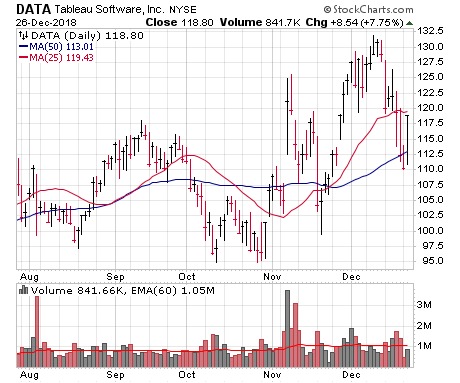
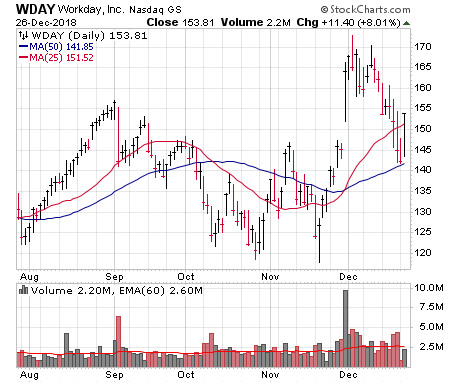
One area where I’m seeing a good amount of these higher-low charts are from firms that are helping other companies boost productivity—cloud software, business intelligence, analytics and the like. Okta (OKTA), Zscaler (ZS), Tableau Software (DATA) and Workday (WDAY) are four of many names I’m keeping an eye on.
9. Last but not least among my current stock market thoughts, while the past three months have been the dog’s dinner, just remember that now’s not the time to stick your head in the sand. In my view, this decline is basically a reset of many stocks’ advances—instead of having to pick among well-known, obvious, late-stage stocks, the next upmove will feature fresh leadership that will likely persist for many months, if not longer.
Said another way, there’s big money to be made once this downturn ends, which of course it will. The key is to keep your wits about you, preserve capital and focus on what counts—the action of the market and leading stocks—even as the news is likely to get worse.
If you can do that, I’m confident 2019 will be a very fruitful year. Happy New Year!
P.S. If you’re a growth investor who would like some help navigating the choppy market waters heading into the New Year, click here to become a Cabot Growth Investor subscriber.
[author_ad]


