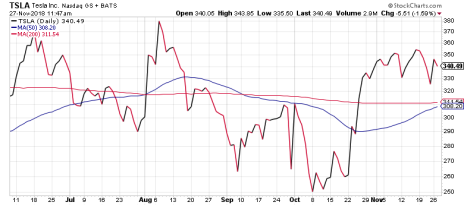
Elon Musk had a rough summer, and Tesla (TSLA) investors paid the price for it. Tesla stock plummeted 60% after peaking at an all-time high of 379 on August 7—the day Musk infamously threatened to take the company private in a tweet that has now cost him $20 million and his position as Tesla chairman. But after bottoming at 250 in early October, TSLA came roaring back at a time when most other stocks were tanking. And now, it’s smack in the middle of its support and resistance levels despite all the recent volatility.
TSLA’s Support and Resistance Lines
Two months ago, it looked like there would be no saving TSLA. The stock fell 14% in one day as investors sold in droves in response to the Securities and Exchange Commission’s (SEC) decision to charge Musk with fraud for his August 7 tweet. On October 8, Tesla stock closed at 250, right around six-month resistance, established in early April.
For those who believe in support and resistance levels, what happened to TSLA next was no surprise: the stock re-tested resistance a couple times before bouncing to 276 and then really taking off in late October. As of this writing, TSLA stock is all the way up to 341, toward the high end (379) of its admittedly wide support and resistance. No lasting harm done from the SEC’s announcement.
[text_ad use_post='129629']
Plenty of obstacles remain for TSLA. Production of the Model 3, its new “affordable” luxury car, is still lagging, with the company pushing to reach 7,000 units of production capacity by the end of this month. Meanwhile, Tesla still isn’t close to profitability, though that’s slated to change next year if you believe analyst estimates. And Musk is seemingly always a tweet or interview away from harming his own company.
But if you own TSLA—and you probably do if you subscribe to our Cabot Stock of the Week advisory (which has a near-four-digit profit in Tesla, having recommended the stock in 2011)—it’s best if you tune out all the headlines and pay attention to just one thing: the chart. A six-month chart (below) shows that TSLA is indeed a volatile stock. But it also shows that it’s well within its intermediate-term trading range—and is one of the rare stocks trading above both its 50- and 200-day moving averages.
Above all, pay attention to those support and resistance levels. There’s overhead resistance all the way up to 380, where it peaked in early August before Musk’s self-sabotaging tweet. And as I mentioned before, support is around 250.
What to Do with TSLA Now
That’s quite the wide range. With TSLA creeping toward the high end of that range, any move to 380 or above should be viewed as a legitimate breakout, and could trigger an even longer rally.
It’s easy to hit the panic button on a stock after it falls as much as TSLA did in August and September. It’s even easier to sell out of a company that attracted as many unflattering headlines (and federal hand-wringing) as Tesla did. But those who’ve stuck with it (like our Cabot Stock of the Week advisory) are likely happy they did. They could be even happier if and when the market rights the ship.
If you don’t own Tesla stock yet, this looks a good time to buy it. The company seems to have weathered the storm, and with the stock setting up a nice base after a big run-up in October, don’t be surprised if it breaks to new highs in the coming months.
Either way, take your cues from chart—not the headlines.
[author_ad]
*This post has been updated from an original version.

