Has a market bottom already been put in? Here are five ways to measure it.
First off, it’s a stressful time for everyone, so let’s start with a quarantine update from a few days ago in the Cintolo household:
The funniest humor is that which has a ring of truth to it, no? OK, now let’s get on to this week’s column.
5 Ways to Tell If the Market Bottom Has Already Happened
[text_ad]
Not surprisingly, the volume of questions and comments I’ve been getting has gone through the roof—mostly about certain stocks, of course, but also about the market and what I’m thinking in this time of maximum uncertainty. Feel free to continue to pepper me with questions, of course, but I figured now is a good time to relay a handful of things I’m watching closest every day to see how the current bounce phase goes.
1. The Major Indexes
Duh! But it’s more than just seeing how many hundreds (or thousands) of points the Dow went up or down a certain day. I’m really looking at a few “levels” to determine how strong the current bounce is—and the stronger the bounce, the greater the odds we really have hit a meaningful low.
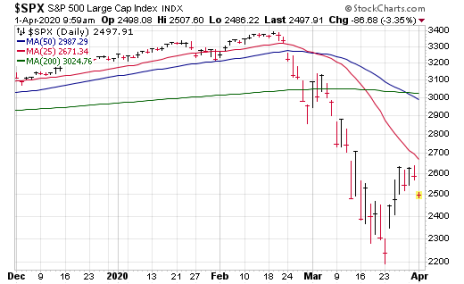
The S&P 500, for instance, basically fell from 3,400 to 2,200—that’s 1,200 points. Thus, a rebound halfway back (which would be reasonable) would make it to 2,800. I would say far above that (2,900 to 3,000) doesn’t necessarily mean it’s up and away, but it would imply the March 23 low could be a major one.
Conversely, if we stall out and things really fall apart soon (we’ve only recouped around 35% of the crash) it would be a sign of weakness—and that the March 23 low might not hold.
2. Number of Stocks Hitting New Lows
Our founder Carlton Lutts named this his Two-Second Indicator, as it only takes two seconds each day to look it up. Back then, he looked solely at the number of stocks hitting new 52-week lows on the NYSE, mostly because the Nasdaq (in its early days) consisted of smaller, speculative stocks. Today, I like to keep an eye on total new lows (NYSE and Nasdaq combined) when the market goes over the falls.
We spotted a positive short-term positive divergence starting March 12 (4,400 new lows) through the bottom on March 23 (“only” 1,600) and it’s dried up nicely on the bounce. Now I’m watching two things: First, of course, whether those new-low figures stay tame on days when the market pulls back. And second, if we do fall back and retest the lows down the road, whether the new-low totals remain far fewer than the 1,600 seen on March 23.
On a day-to-day basis, these readings can give you a strong clue as to the health of the broad market, so they’re worth it.
3. Cabot’s Aggression Index
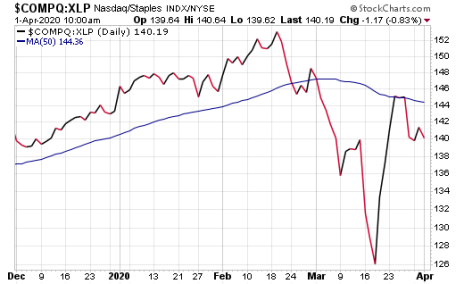
This my favorite way of looking at how aggressive big investors are in their positioning. In other words, are they buying (or I guess not selling) growth stocks? Or are they snapping up shares of safe, dividend-paying stocks in defensive industries? I do this by comparing the relative action of the Nasdaq to the Consumer Staples ETF (XLP), which we’ve dubbed our Aggression Index, the chart of which is shown below.
So far, the action is very interesting: You can see the index broke below its 50-day line in early March as the market imploded—not surprising. But what was surprising is that it bottomed a few days ahead of the market and made it all the way back to the 50-day line before pulling back a bit. The longer this holds up (or, even better, pushes higher), the better for the market and for growth stocks on the other side of this decline.
4. Sentiment: Do Investors Embrace the Rally?
Investor sentiment turned ugly/scared/panicky near the low, but should this rally go on for a while, my question is whether investors really embrace it—in the contrary world of the market, that would probably be a bad thing.
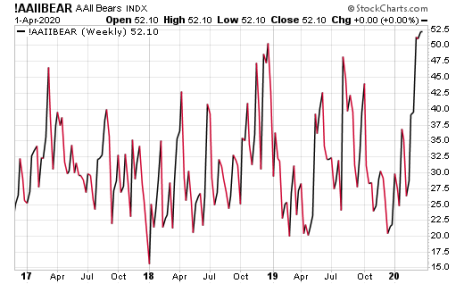
One of many ways to track this would be by looking at the percent of bearish individual investors via AAII. For three straight weeks, more than 50% of respondents were bearish (first time that’s happened since 2008). Should this figure remain elevated (north of 40%) even after the rally, it would probably be a good overall sign for the market—but a plunge below 30% (especially if it stays there for a week or two) would likely tell us not enough investors were beaten down.
5. Leading Growth Stocks
Encouragingly, there are many growth stocks that (similar to the Aggression Index) found support ahead of the market’s low and then surged on big volume as soon as the pressure came off the indexes. I’ll be watching a handful of these to see if they can build on or (should the market back off) hold their recent gains.
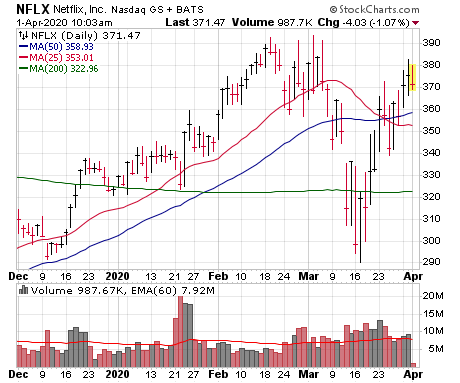
For instance, look at Netflix (NFLX), which has shown outstanding “tennis ball” action after its three-week plunge; it’s currently near the top of a huge 21-month launching pad. Some volatility would be normal after its snapback, but does it (and other stocks I’m watching) melt down (bad)? Do they tighten up (good)? Do they explode to new highs on huge trading volume and never look back (better)? The action of potential leaders always tells you a lot about the market’s health.
[author_ad]
