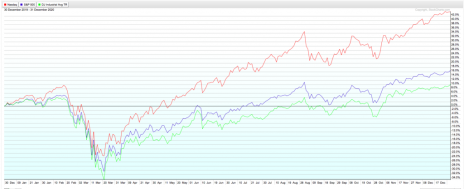
2021 was a strong year for large-cap stocks, with the major indexes up between 18.7% (Dow Jones) and 26.9% (S&P 500), with the Nasdaq falling roughly in the middle of that range at 21.4%. Broadly speaking, we expect to see that kind of correlation in index returns. But we don’t need to look too closely in the rear-view mirror to find divergent index returns that are more the exception than the rule. In fact, we just need to look at 2020.
2020 was a great year for tech stocks. The Nasdaq was up 43.6% - its best performance since 2009.
2020 was a good year for large-cap stocks. The S&P 500 was up 16.4%.
2020 was an average year for the old dividend stalwarts that comprise the Dow Jones Industrial Average. It was up a more modest 7.3% (see chart below).
That kind of divergence between the major stock market indexes isn’t normal. But then again, very little about 2020 was normal (it was, after all, a year in which we had both toilet paper shortages and murder hornets).
[text_ad]
How abnormal were those divergent index returns? I looked back to the beginning of the century and found only three that were similar: 2000, 2003 and 2009. Those were the only other years in which there was at least a 20% separation between two of the three major indexes, as there was between the Nasdaq and the two other indexes last year (the Nasdaq and Dow were closer to 40% apart).
Here were the divergences:
3 Previous Divergent Index Returns
2000
S&P 500: -10.1%
Nasdaq: -39.3%
Dow Jones: -6.2%
2003
S&P 500: 26.4%
Nasdaq: 50.0%
Dow Jones: 25.3%
2009
S&P 500: 23.5%
Nasdaq: 43.9%
Dow Jones: 18.8%
Like 2020, the divergences those years were mostly between the Nasdaq and the other two indexes; the S&P and the Dow were more or less aligned, within 5% of each other (the gap was actually 9% last year). Also like last year, those divergences occurred either in the midst of or on the heels of some sort of extreme event.
2000 was the year the dot-com bubble, which had driven internet stocks to unsustainable valuations and share prices, finally burst. The indexes fell apart, but none more so than the tech-heavy Nasdaq, where many of those overinflated internet stocks resided.
The bursting of the dot-com bubble, combined with the 9/11 attacks in 2001, led to a three-year bear market. Stocks didn’t even begin to recover until 2003. And the worst performers were (naturally) the internet stocks that managed to survive the dot-com bubble bursting purge. Thus, their recovery was swifter, causing the Nasdaq to outpace both the S&P and the Dow by more than 20% that year.
And, of course, there was 2009, which was the year America finally stopped the bleeding from the Great Recession, caused by the subprime mortgage crisis. Again, Nasdaq stocks, because of their high valuations prior to 2008, had suffered the worst of the sell-off. So when stocks started their long recovery, in March 2009, the Nasdaq rose the fastest.
Each situation is different. A global pandemic is a whole different animal from a dot-com bubble burst or a normal (i.e. not self-imposed, for health reasons) recession.
But the abnormal divergent index returns of 2020 are actually normal for crisis or post-crisis years. In fact, we saw a micro version of that to end 2021 and start this year, with the Nasdaq coming 20% off its recent highs, roughly double the losses of the other two major indexes. That ended up closing the one-year return gap quite a bit, due to fears of rising inflation, rate hikes, and now the Russia/Ukraine situation.
Thus, risk is higher than normal for technology stocks. But as the nine months that followed 2020’s February-March market crash showed, so are the rewards. Invest accordingly.
[author_ad]
*This post has been updated from an original version.


