The S&P 500 is now in bear territory, which should not be particularly surprising to anyone.
The economy is slowing, inflation is high, war is still raging in Ukraine and China’s economy is not in good shape.
For investors, the trick is to not get discouraged about the current market, but instead, to seek opportunities to profit.
That’s exactly the point of the Undiscovered Portfolio (more about that below). If you’ve invested in that portfolio, you know we’ve been able to identify exchange-traded funds with higher probabilities of delivering positive returns in this market.
Cabot ETF Strategist Issue: June 14, 2022
Key Highlights This Month
The S&P 500 is now in bear territory, which should not be particularly surprising to anyone.
The economy is slowing, inflation is high, war is still raging in Ukraine and China’s economy is not in good shape.
For investors, the trick is to not get discouraged about the current market, but instead, to seek opportunities to profit.
That’s exactly the point of the Undiscovered Portfolio (more about that below). If you’ve invested in that portfolio, you know we’ve been able to identify exchange-traded funds with higher probabilities of delivering positive returns in this market.
“Past performance is no indication of future returns.”
We’ve all heard that phrase, but It’s about time investors started believing it.
Since November, we’ve seen several trends in the broader market and economy, but with their own unique twists:
- The S&P 500 recently fell to its lows of 15 months ago. While it’s since rebounded a little, Friday’s gap-down indicates the potential for another bout of selling.
- Consumer credit surged by $38 billion in April, spurred by rising prices amid the highest inflation in 40 years.
- The savings rate it at its lowest level since 2008. That’s somewhat of a positive sign, in the sense that consumer spending is by far largest contributor to the U.S. economy. On the other hand, it could be a harbinger of more pain ahead if consumers fail to keep up with their debt payments. That could result in a slowdown in the pace of inflation-adjusted consumption
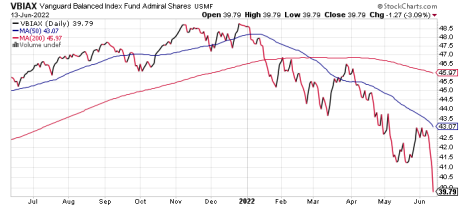
- The one-year return for the Vanguard Balanced Index Fund Admiral Shares (VBIAX), a typical representative of “buy and hold” investing, stands at -6%. It’s currently trading at February 2021 levels, having given up all its 2021 gains.
- Making matters worse, bonds aren’t providing ballast and stability as they historically have.
All of this means we cannot simply follow the same investing style that worked in 2020 and 2021, at least for now.
We are seeing excellent opportunities to generate positive returns from the stock market and gradually from the bond market, but the trajectory is going to be different and not as straightforward as it was in recent years. Investment success for the rest of this decade will likely be the result of balancing offensive and defensive approaches.
When it comes to our view of the asset classes, we see corporate, high-yield, municipal, and convertible bonds, as well as preferred stock, as most likely to remain in the “laggard” category.
Strategy
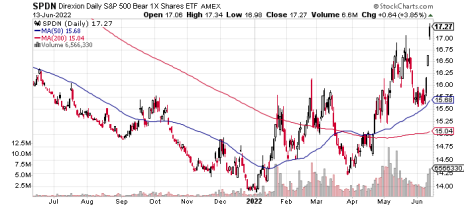
- This market environment calls for using inverse securities such as the Direxion Daily S&P 500 Bear 1x Shares ETF (SPDN), one of the Undiscovered holdings. This ETF is an inverse of the S&P 500 and is up 9% since it was added in late March. Compare that to performance S&P 500 itself, which is down since that date.
- Expand your universe of investments to include those that can profit when stocks or bonds fall. Be ready, willing and able to speed up your transaction pace and shorten your investment horizon to a “rental” time frame instead of an “ownership” mindset.
- However, as noted below, we’re not just trading for the sake of trading. Frequent trading may feel fun and satisfying on some level, as you may have the sense of “doing something,” but it’s not necessary every day or even every week or month.
Undiscovered Portfolio
Along those lines, there have been no new trades in the Undiscovered ETF portfolio for a while. That might feel frustrating if you like more frequent trading action, but it’s important to understand the reason we’re continuing to hold.
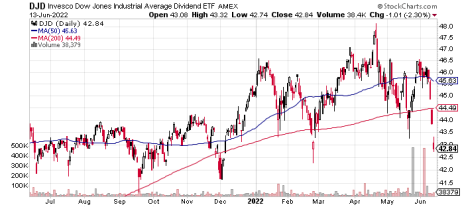
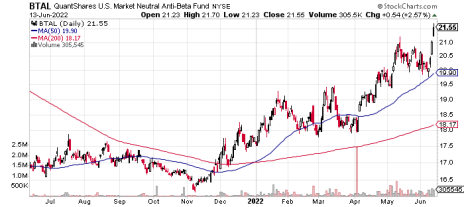
In the table below, you will see the returns of the securities we currently hold. Three of the four are up since we purchased, and the fourth is down less than the broader market. This is exactly what you want to see during a downturn!
Undiscovered is a simple-to-use, four-ETF portfolio. Unlike a portfolio of, say, 20 to 30 stocks that you might trade more frequently, there will be times when the best trade is … no trade at all!
In fact, our existing positions are doing so well, that the old adage, “If it ain’t broke, don’t fix it” applies here.
When we opt not to trade, it usually means our returns are crushing the market. That’s the case so far in 2022 with the Undiscovered ETF model. We fully expect to get more active with the trades as the year goes on. But we will only trade when we see opportunities to “upgrade” existing positions.
However, there is also some big news: In the coming weeks, we plan to introduce some additional models to Cabot ETF Strategist, so you can expect more activity once our offering broadens. Stay tuned!
Undiscovered Portfolio Performance
| Undiscovered | Symbol | Date Bought | Price Bought | Price on 5/13/22 | Dividends | Div Freq. | Gain/ Loss % | Allocation |
| Invesco Dow Jones Industrial Average Dividend ETF | DJD | 4/8/22 | 46.35 | 42.84 | 0.00 | Quarterly | -8% | 0.4 |
| VanEck Morningstar International Moat ETF | BTAL | 4/26/22 | 19.86 | 21.55 | 0.00 | - | 9% | 0.3 |
| Direxion Daily S&P 500 Bear 1X Shares | SPDN | 2/18/22 | 15.27 | 17.27 | 0.00 | Quarterly | 13% | 0.2 |
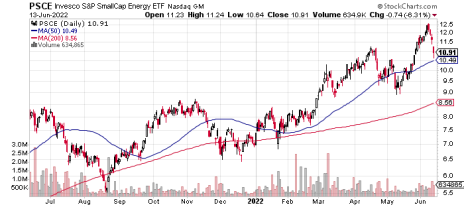
| Invesco S&P SmallCap Energy ETF | PSCE | 3/28/22 | 10.05 | 10.91 | 0.00 | Quarterly | 9% | 0.1 |
Current Portfolio
| Aggressive (100% Equity) | Symbol | Date Bought | Price Bought | Price on 6/15/22 | Dividends | Div Freq. | Gain/ Loss % | Allocation |
| iShares Core S&P 500 | IVV | 2/8/22 | 452.82 | 378.10 | 1.48 | Quarterly | -16% | 0.36 |
| iShares US Energy | IYE | 2/8/22 | 36.17 | 43.87 | 0.33 | Quarterly | 22% | 0.04 |
| iShares Edge MSCI Min Vol USA ETF | BATS:USMV | 2/8/22 | 75.92 | 68.29 | 0.27 | Quarterly | -10% | 0.02 |
| iShares MSCI USA Value Factor | VLUE | 2/8/22 | 24.02 | 21.17 | 0.73 | Quarterly | -9% | 0.02 |
| iShares MSCI EAFE Value | EFV | 2/8/22 | 0.02 | 0.02 | 0.00 | Semi-Annual | 0% | 0.11 |
| iShares MSCI EM ESG Optimized ETF | ESGE | 2/8/22 | 40.01 | 32.60 | 0.00 | Semi-Annual | -19% | 0.05 |
| iShares MSCI EAFE Growth | EFG | 2/8/22 | 99.12 | 79.27 | 0.00 | Semi-Annual | -20% | 0.06 |
| iShares Global Tech | IXN | 2/8/22 | 58.95 | 46.02 | 0.00 | Semi-Annual | -22% | 0.03 |
| iShares MSCI USA ESG Optimized ETF | ESGU | 2/8/22 | 101.43 | 83.79 | 0.32 | Quarterly | -17% | 0.25 |
| iShares Core S&P Small-Cap | IJR | 2/8/22 | 106.93 | 93.80 | 0.17 | Quarterly | -12% | 0.04 |
| Cash / Money Market | 0 | 0.02 | ||||||
| Moderate (60/40 Model) | Symbol | Date Bought | Price Bought | Price on 6/15/22 | Dividends | Div Freq. | Gain/ Loss % | Allocation |
| iShares Global Tech | IXN | 2/8/22 | 58.95 | 46.02 | 0.00 | Semi-Annual | -22% | 0.015 |
| iShares Core Total USD Bond Market | IUSB | 2/8/22 | 51.17 | 46.03 | 0.25 | Monthly | -10% | 0.16 |
| iShares Core S&P Small-Cap | IJR | 2/8/22 | 106.93 | 93.80 | 0.17 | Quarterly | -12% | 0.025 |
| iShares Edge MSCI Min Vol USA ETF | BATS:USMV | 2/8/22 | 75.92 | 68.29 | 0.27 | Quarterly | -10% | 0.015 |
| iShares Core US Treasury Bond | BATS:GOVT | 2/8/22 | 25.66 | 23.39 | 0.07 | Monthly | -9% | 0.09 |
| iShares Commodities Select Strategy | COMT | 2/8/22 | 34.15 | 44.60 | 0.00 | Annual | 31% | 0.035 |
| iShares MSCI USA Value Factor | VLUE | 2/8/22 | 24.02 | 21.17 | 0.73 | Quarterly | -9% | 0.015 |
| iShares MSCI EM ESG Optimized ETF | ESGE | 2/8/22 | 40.01 | 32.60 | 0.00 | Semi-Annual | -19% | 0.03 |
| iShares MSCI EAFE Value | EFV | 2/8/22 | 0.02 | 0.02 | 0.00 | Semi-Annual | 0% | 0.07 |
| iShares MSCI USA ESG Optimized ETF | ESGU | 2/8/22 | 101.43 | 83.79 | 0.32 | Quarterly | -17% | 0.16 |
| iShares Fallen Angels USD Bond ETF | FALN | 2/8/22 | 28.27 | 24.90 | 0.30 | Monthly | -11% | 0.03 |
| Cash / Money Market | 2/8/22 | - | - | 0.00 | - | 0% | 0.02 | |
| iShares TIPS Bond | TIP | 2/8/22 | 123.70 | 113.90 | 1.97 | Monthly | -6% | 0.025 |
| iShares MSCI EAFE Growth | EFG | 2/8/22 | 99.12 | 79.27 | 0.00 | Semi-Annual | -20% | 0.035 |
| iShares Core S&P 500 | IVV | 2/8/22 | 452.82 | 378.10 | 1.48 | Quarterly | -16% | 0.235 |
| iShares 10-20 Year Treasury Bond | TLH | 2/8/22 | 140.34 | 115.28 | 0.62 | Monthly | -17% | 0.02 |
| iShares US Energy | IYE | 2/8/22 | 36.17 | 43.87 | 0.33 | Quarterly | 22% | 0.02 |
| Conservative (20/80 Model) | Symbol | Date Bought | Price Bought | Price on 6/15/22 | Dividends | Div Freq. | Gain/ Loss % | Allocation |
| iShares Short-Term Corporate Bond ETF | IGSB | 2/8/22 | 52.94 | 50.08 | 0.21 | Monthly | -5% | 0.01 |
| Cash / Money Market | 2/8/22 | - | - | 0.00 | — | 0% | 0.02 | |
| iShares TIPS Bond | TIP | 2/8/22 | 123.70 | 113.90 | 1.97 | Monthly | -6% | 0.06 |
| iShares MSCI EAFE Value | EFV | 2/8/22 | 0.02 | 0.02 | 0.00 | Semi-Annual | 0% | 0.025 |
| iShares MSCI EAFE Growth | EFG | 2/8/22 | 99.12 | 79.27 | 0.00 | Semi-Annual | -20% | 0.015 |
| iShares Core S&P 500 | IVV | 2/8/22 | 452.82 | 378.10 | 1.48 | Quarterly | -16% | 0.085 |
| iShares MSCI EM ESG Optimized ETF | ESGE | 2/8/22 | 40.01 | 32.60 | 0.00 | Semi-Annual | -19% | 0.01 |
| iShares Core US Treasury Bond | BATS:GOVT | 2/8/22 | 25.66 | 23.39 | 0.07 | Monthly | -9% | 0.195 |
| iShares Convertible Bond ETF | ICVT | 2/8/22 | 83.73 | 69.90 | 0.21 | Monthly | -16% | 0.015 |
| iShares J.P. Morgan USD Emerging Markets Bond ETF | EMB | 2/8/22 | 103.96 | 86.11 | 1.10 | Monthly | -16% | 0.015 |
| iShares MBS ETF | MBB | 2/8/22 | 104.86 | 94.89 | 0.42 | Monthly | -9% | 0.085 |
| iShares Core Total USD Bond Market | IUSB | 2/8/22 | 51.17 | 46.03 | 0.25 | Monthly | -10% | 0.27 |
| iShares MSCI USA ESG Optimized ETF | ESGU | 2/8/22 | 101.43 | 83.79 | 0.32 | Quarterly | -17% | 0.065 |
| iShares Core S&P Small-Cap | IJR | 2/8/22 | 106.93 | 93.80 | 0.17 | Quarterly | -12% | 0.01 |
| iShares Commodities Select Strategy | COMT | 2/8/22 | 34.15 | 44.60 | 0.00 | Annual | 31% | 0.02 |
| iShares Fallen Angels USD Bond ETF | FALN | 2/8/22 | 28.27 | 24.90 | 0.30 | Monthly | -11% | 0.1 |
| Undiscovered | Symbol | Date Bought | Price Bought | Price on 6/15/22 | Dividends | Div Freq. | Gain/ Loss % | Allocation |
| Invesco Dow Jones Industrial Average Dividend ETF | DJD | 4/8/22 | 46.35 | 42.98 | 0.00 | Quarterly | -7% | 0.4 |
| VanEck Morningstar International Moat ETF | BTAL | 4/26/22 | 19.86 | 21.31 | 0.00 | - | 7% | 0.3 |
| Direxion Daily S&P 500 Bear 1X Shares | SPDN | 2/18/22 | 15.27 | 17.13 | 0.02 | Quarterly | 12% | 0.2 |
| Invesco S&P SmallCap Energy ETF | PSCE | 3/28/22 | 10.05 | 10.78 | 0.01 | Quarterly | 7% | 0.1 |
The next Cabot ETF Strategist issue will be published on July 12, 2022.
About the Analyst
Kate Stalter
A Series 65-licensed asset manager, with more than two decades of experience in various areas of financial services. As an investment advisor and financial planner, Kate personally manages client portfolios, with a focus on successful retirement, including asset allocation, income generation and tax strategies.
Kate also serves as a capital-markets contributor at Forbes.com, and is an expert columnist for the investment advisory channel at U.S. News & World Report.
She served as trading instructor and market commentator for Investor’s Business Daily, and launched the “Small Cap Roundup” radio show and stock newsletter for Tiger Financial News Network. Kate hosted the “Daily Guru” podcast for MoneyShow, while also serving as a MoneyShow market columnist and video host.
She currently owns registered investment advisory firm ProsperitySource Advisors, which focuses on broad allocation strategies, incorporating global equity and fixed-income asset classes and all market capitalizations.
