One key tenet of asset allocation is risk management. You’ll find that principle to be much more salient when it comes to investing an entire portfolio, as opposed to simply trading individual stocks.
That’s even more critical during a bout of market volatility, such as what we’re currently experiencing.
Sure, it’s possible and even desirable to diversify in a single-stock account. For example, you can potentially mitigate risk by owning stocks from various sectors, or at least sub-industries within a sector.
That’s exactly why ETFs serve a role as “instant diversifiers.” Because they track a basket of securities, you’ll generally smooth out performance to a larger degree than with a single-stock portfolio.
Cabot ETF Strategist Issue: May 10, 2022
Risk Management in Asset Allocation
One key tenet of asset allocation is risk management. You’ll find that principle to be much more salient when it comes to investing an entire portfolio, as opposed to simply trading individual stocks. That’s even more critical during a bout of market volatility, such as what we’re currently experiencing.
Sure, it’s possible and even desirable to diversify in a single-stock account. For example, you can potentially mitigate risk by owning stocks from various sectors, or at least sub-industries within a sector.
That’s exactly why ETFs serve a role as “instant diversifiers.” Because they track a basket of securities, you’ll generally smooth out performance to a larger degree than with a single-stock portfolio.
And yes, risk and return are related.
The greater the risk, the greater your potential for either a higher profit or higher loss. Historically, the more equities you hold, by percentage allocation within a portfolio, the more risk you are taking.
You don’t get a pat on the head and an “attaboy” or “attagirl” for claiming a high risk tolerance. Instead, risk tolerance should be pegged to your financial goals, time horizon, income needs and other planning factors.
Risk Management in the Undiscovered Portfolio
Despite the more frequent trading in the Undiscovered Portfolio, there’s a high degree of risk management built into the methodology.
| Undiscovered Portfolio | ||||
| 40% | Invesco Dow Jones Industrial Average Dividend ETF (DJD) | |||
| 30% | VanEck Morningstar International Moat ETF (BTAL) | |||
| 20% | Direxion Daily S&P 500 Bear 1X Shares (SPDN) | |||
| 10% | Invesco S&P SmallCap Energy ETF (PSCE) | |||
The Undiscovered Portfolio, which consists of smaller or less-well-known funds, is diversified with ETFs representing various asset classes currently performing well on a technical basis.
The goal with this portfolio is to generate excess return above the broad market, regardless of what the market is doing at any given time.
Even so, we incorporate a risk calculation into this allocation. That’s done by carefully balancing the inherent risk levels of each ETF with the portfolio weighting.
Here are the current allocations, listed by risk level, as determined by past performance:
- PSCE
- SPDN
- BTAL
- DJD
As you see when you compare that list to the above table, the allocations are in direct inverse to the fund risk levels. That’s in the interest of generating a positive return even in a downward-trending market, while limiting exposure to the highest-risk securities.
Over the next six months, the entire Undiscovered Portfolio has a 95% chance of its return landing in the range between a loss of 8.32% and a gain of 7.52%.
So why is the Invesco S&P SmallCap Energy ETF (PSCE) the highest-risk fund?
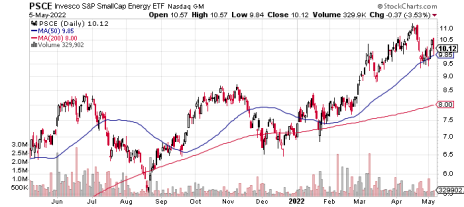
This ETF has a 95% probability of landing in a range between a loss of 65.85% and a gain of 59.08% in the next six months. That’s quite a wide range, and that added uncertainty is exactly what can potentially reward buyers.
Its expected return is a loss of 3.39%.
So why are we holding this? It’s not designed as a long-term buy-and-hold position. Instead, it’s intended to capture fast gains, while the energy sector continues to lead.
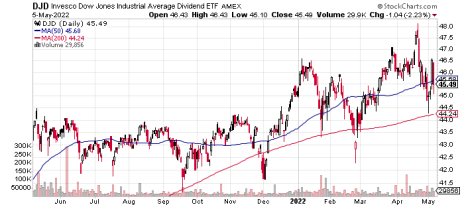
Meanwhile, the least risky fund in the portfolio, the Invesco Dow Jones Industrial Average Dividend ETF (DJD), has a 95% chance that it will return somewhere in the range between a loss of 15.80% and a gain of 25.59%. Its expected return is 4.40%.
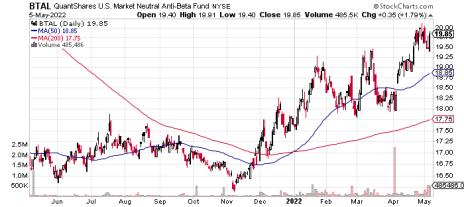
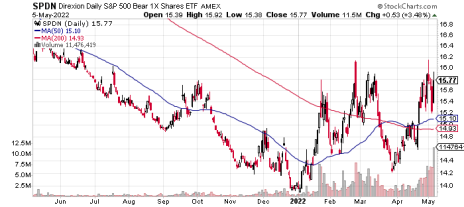
Below are charts for the funds currently held in the Undiscovered Portfolio.
Invesco Dow Jones Industrial Average Dividend ETF (DJD): This ETF tracks its namesake index, comprised of dividend-paying equities in the Dow Jones Industrial Average, weighted according to their dividend yield over the prior 12 months. The advantage here is to capture dividends during a downward-trending or volatile market.
AGFiQ US Market Neutral Anti-Beta (BTAL): This ETF aims to generate positive returns regardless of the direction of the general market, as long as low-beta stocks outperform high-beta stocks. The fund uses long and short positions to achieve its objective. It typically goes long in low-beta U.S. equities and takes short positions in high-beta domestic equities. The idea is to construct a “dollar neutral” portfolio. At its most basic, that means holding both long and short positions on the same underlying security.
Direxion Daily S&P 500 Bear 1X Shares (SPDN): This fund seeks a return that is the 100% inverse of the S&P 500 index for a single day. Single inverse ETFs allow investors to either seek profit when a benchmark index is trading lower, or to apply a hedge for an existing portfolio position that they anticipate will show a negative return in the short term.
Invesco S&P SmallCap Energy ETF (PSCE): While you may be familiar with the large-cap S&P 500 energy sector, you may not have as much awareness when it comes to the small-cap energy names tracked in the S&P 600 index. This ETF measures overall performance of small companies engaged in the business of producing, distributing or servicing energy-related products, including oil and gas exploration and production, refining, oil services and pipelines. The average market cap is currently $3.789 billion, which is higher than the traditional definition of small cap, which tops out at $2 billion. However, recent strength in the energy sector has pushed the average market cap higher.
Strategic Allocations
The Aggressive and Moderate strategic allocations were updated in mid-March. There have been no changes to the Conservative allocation recently.
Remember, the purpose of the strategic allocations is to spread the risk while generating the return needed for a specific goal, such as retirement.
These portfolios are traded out at intervals, when the allocations become too far out of alignment with the established percentages.
Strategic portfolios trade infrequently, and that’s by design. In the coming months, as market conditions change, we will alert you to rebalancing trades, but at this time, there are no additional changes to be made.
| Symbol | Description | Allocation |
| 60/40 Model | ||
| IVV | iShares Core S&P 500 | 23.5% |
| IUSB | iShares Core Total USD Bond Market | 16.0% |
| ESGU | iShares MSCI USA ESG Optimized ETF | 16.0% |
| GOVT | iShares Core US Treasury Bond | 9.0% |
| EFV | iShares MSCI EAFE Value | 7.0% |
| EFG | Shares MSCI EAFE Growth | 3.5% |
| COMT | iShares Commodities Select Strategy | 3.5% |
| ESGE | iShares MSCI EM ESG Optimized ETF | 3.0% |
| FALN | iShares Fallen Angels USD Bond ETF | 3.0% |
| TIP | iShares TIPS Bond | 2.5% |
| IJR | iShares Core S&P Small-Cap | 2.5% |
| TLH | iShares 10-20 Year Treasury Bond | 2.0% |
| Cash/Money Market | 2.0% | |
| IYE | iShares US Energy | 2.0% |
| IXN | iShares Global Tech | 1.5% |
| VLUE | iShares MSCI USA Value Factor | 1.5% |
| USMV | iShares Edge MSCI Min Vol USA ETF | 1.50% |
| 100.0% | ||
| 100% Equity Model | ||
| IVV | iShares Core S&P 500 | 36% |
| ESGU | iShares MSCI USA ESG Optimized ETF | 25% |
| EFV | iShares MSCI EAFE Value | 11% |
| EFG | Shares MSCI EAFE Growth | 6% |
| ESGE | iShares MSCI EM ESG Optimized ETF | 5% |
| IYE | iShares US Energy | 4% |
| IJR | iShares Core S&P Small-Cap | 4% |
| VLUE | iShares MSCI USA Value Factor | 3% |
| IXN | iShares Global Tech | 3% |
| USMV | iShares Edge MSCI Min Vol USA ETF | 2% |
| Cash/Money Market | 2% | |
| 100% | ||
| 20/80 Model | ||
| IGSB | iShares Short-Term Corporate Bond ETF | 1.0% |
| Cash / Money Market | 2.0% | |
| TIP | iShares TIPS Bond | 6.0% |
| EFV | iShares MSCI EAFE Value | 2.5% |
| EFG | iShares MSCI EAFE Growth | 1.5% |
| IVV | iShares Core S&P 500 | 8.5% |
| ESGE | iShares MSCI EM ESG Optimized ETF | 1.0% |
| GOVT | iShares Core US Treasury Bond | 19.5% |
| ICVT | iShares Convertible Bond ETF | 1.5% |
| EMB | iShares J.P. Morgan USD Emerging Markets Bond ETF | 1.5% |
| MBB | iShares MBS ETF | 8.5% |
| IUSB | iShares Core Total USD Bond Market | 27.0% |
| ESGU | iShares MSCI USA ESG Optimized ETF | 6.5% |
| IJR | iShares Core S&P Small-Cap | 1.0% |
| COMT | iShares Commodities Select Strategy | 2.0% |
| FALN | iShares Fallen Angels USD Bond ETF | 10.0% |
| 100.0% |
While the broader market remains in a decline year to date, we’ll continue to monitor for necessary rebalancing as asset classes rotate in and out of leadership. With consumer discretionary showing renewed strength, we’re keeping an eye on allocations to determine whether that sector should eventually get a larger share of dollars assigned to it.
Remember: These trades are made strategically, and not based on stops or technical analysis; they are driven by our research and the investment corridors and will trade less frequently than the Undiscovered portfolio.
Update on the current strategic portfolios:
| Cabot ETF Strategist | ||||||||
| Aggressive (100% Equity) | Symbol | Date Bought | Price Bought | Price on 5/10/22 | Dividends | Div Freq. | Gain/ Loss % | Allocation |
| iShares Core S&P 500 | IVV | 2/8/22 | 452.82 | 405.33 | 1.48 | Quarterly | -10% | 0.36 |
| iShares US Energy | IYE | 2/8/22 | 36.17 | 41.32 | 0.33 | Quarterly | 15% | 0.04 |
| iShares Edge MSCI Min Vol USA ETF | BATS:USMV | 2/8/22 | 75.92 | 71.08 | 0.27 | Quarterly | -6% | 0.02 |
| iShares MSCI USA Value Factor | VLUE | 2/8/22 | 24.02 | 21.97 | 0.73 | Quarterly | -6% | 0.02 |
| iShares MSCI EAFE Value | EFV | 2/8/22 | 0.02 | 0.02 | 0.00 | Semi-Annual | 0% | 0.11 |
| iShares MSCI EM ESG Optimized ETF | ESGE | 2/8/22 | 40.01 | 32.53 | 0.00 | Semi-Annual | -19% | 0.05 |
| iShares MSCI EAFE Growth | EFG | 2/8/22 | 99.12 | 83.81 | 0.00 | Semi-Annual | -15% | 0.06 |
| iShares Global Tech | IXN | 2/8/22 | 58.95 | 50.05 | 0.00 | Semi-Annual | -15% | 0.03 |
| iShares MSCI USA ESG Optimized ETF | ESGU | 2/8/22 | 101.43 | 89.84 | 0.32 | Quarterly | -11% | 0.25 |
| iShares Core S&P Small-Cap | IJR | 2/8/22 | 106.93 | 97.16 | 0.17 | Quarterly | -9% | 0.04 |
| Cash / Money Market | 0 | 0.02 | ||||||
| Moderate (60/40 Model) | Symbol | Date Bought | Price Bought | Price on 5/10/22 | Dividends | Div Freq. | Gain/ Loss % | Allocation |
| iShares Global Tech | IXN | 2/8/22 | 58.95 | 50.05 | 0.00 | Semi-Annual | -15% | 0.015 |
| iShares Core Total USD Bond Market | IUSB | 2/8/22 | 51.17 | 47.43 | 0.25 | Monthly | -7% | 0.16 |
| iShares Core S&P Small-Cap | IJR | 2/8/22 | 106.93 | 97.16 | 0.17 | Quarterly | -9% | 0.025 |
| iShares Edge MSCI Min Vol USA ETF | BATS:USMV | 2/8/22 | 75.92 | 71.89 | 0.27 | Quarterly | -5% | 0.015 |
| iShares Core US Treasury Bond | BATS:GOVT | 2/8/22 | 25.66 | 24.02 | 0.07 | Monthly | -6% | 0.09 |
| iShares Commodities Select Strategy | COMT | 2/8/22 | 34.15 | 40.83 | 0.00 | Annual | 20% | 0.035 |
| iShares MSCI USA Value Factor | VLUE | 2/8/22 | 24.02 | 21.97 | 0.73 | Quarterly | -6% | 0.015 |
| iShares MSCI EM ESG Optimized ETF | ESGE | 2/8/22 | 40.01 | 32.53 | 0.00 | Semi-Annual | -19% | 0.03 |
| iShares MSCI EAFE Value | EFV | 2/8/22 | 0.02 | 0.02 | 0.00 | Semi-Annual | 0% | 0.07 |
| iShares MSCI USA ESG Optimized ETF | ESGU | 2/8/22 | 101.43 | 89.84 | 0.32 | Quarterly | -11% | 0.16 |
| iShares Fallen Angels USD Bond ETF | FALN | 2/8/22 | 28.27 | 25.90 | 0.30 | Monthly | -7% | 0.03 |
| Cash / Money Market | 2/8/22 | - | - | 0.00 | - | 0% | 0.02 | |
| iShares TIPS Bond | TIP | 2/8/22 | 123.70 | 117.70 | 1.97 | Monthly | -3% | 0.025 |
| iShares MSCI EAFE Growth | EFG | 2/8/22 | 99.12 | 83.81 | 0.00 | Semi-Annual | -15% | 0.035 |
| iShares Core S&P 500 | IVV | 2/8/22 | 452.82 | 405.33 | 1.48 | Quarterly | -10% | 0.235 |
| iShares 10-20 Year Treasury Bond | TLH | 2/8/22 | 140.34 | 121.48 | 0.62 | Monthly | -13% | 0.02 |
| iShares US Energy | IYE | 2/8/22 | 36.17 | 41.32 | 0.33 | Quarterly | 15% | 0.02 |
| Conservative (20/80 Model) | Symbol | Date Bought | Price Bought | Price on 5/10/22 | Dividends | Div Freq. | Gain/ Loss % | Allocation |
| iShares Short-Term Corporate Bond ETF | IGSB | 2/8/22 | 52.94 | 51.02 | 0.21 | Monthly | -3% | 0.01 |
| Cash / Money Market | 2/8/22 | - | - | 0.00 | — | 0% | 0.02 | |
| iShares TIPS Bond | TIP | 2/8/22 | 123.70 | 117.70 | 1.97 | Monthly | -3% | 0.06 |
| iShares MSCI EAFE Value | EFV | 2/8/22 | 0.02 | 0.02 | 0.00 | Semi-Annual | 0% | 0.025 |
| iShares MSCI EAFE Growth | EFG | 2/8/22 | 99.12 | 83.81 | 0.00 | Semi-Annual | -15% | 0.015 |
| iShares Core S&P 500 | IVV | 2/8/22 | 452.82 | 405.33 | 1.48 | Quarterly | -10% | 0.085 |
| iShares MSCI EM ESG Optimized ETF | ESGE | 2/8/22 | 40.01 | 32.53 | 0.00 | Semi-Annual | -19% | 0.01 |
| iShares Core US Treasury Bond | BATS:GOVT | 2/8/22 | 25.66 | 24.02 | 0.07 | Monthly | -6% | 0.195 |
| iShares Convertible Bond ETF | ICVT | 2/8/22 | 83.73 | 71.84 | 0.21 | Monthly | -14% | 0.015 |
| iShares J.P. Morgan USD Emerging Markets Bond ETF | EMB | 2/8/22 | 103.96 | 89.41 | 1.10 | Monthly | -13% | 0.015 |
| iShares MBS ETF | MBB | 2/8/22 | 104.86 | 98.17 | 0.42 | Monthly | -6% | 0.085 |
| iShares Core Total USD Bond Market | IUSB | 2/8/22 | 51.17 | 47.43 | 0.25 | Monthly | -7% | 0.27 |
| iShares MSCI USA ESG Optimized ETF | ESGU | 2/8/22 | 101.43 | 89.84 | 0.32 | Quarterly | -11% | 0.065 |
| iShares Core S&P Small-Cap | IJR | 2/8/22 | 106.93 | 97.16 | 0.17 | Quarterly | -9% | 0.01 |
| iShares Commodities Select Strategy | COMT | 2/8/22 | 34.15 | 40.83 | 0.00 | Annual | 20% | 0.02 |
| iShares Fallen Angels USD Bond ETF | FALN | 2/8/22 | 28.27 | 25.90 | 0.30 | Monthly | -7% | 0.1 |
| Undiscovered | Symbol | Date Bought | Price Bought | Price on 5/10/22 | Dividends | Div Freq. | Gain/ Loss % | Allocation |
| Invesco Dow Jones Industrial Average Dividend ETF | DJD | 4/8/22 | 46.35 | 45.54 | 0.00 | Quarterly | -2% | 0.4 |
| VanEck Morningstar International Moat ETF | BTAL | 4/26/22 | 19.86 | 20.55 | 0.00 | - | 3% | 0.3 |
| Direxion Daily S&P 500 Bear 1X Shares | SPDN | 2/18/22 | 15.27 | 16.16 | 0.02 | Quarterly | 6% | 0.2 |
| Invesco S&P SmallCap Energy ETF | PSCE | 3/28/22 | 10.05 | 9.55 | 0.01 | Quarterly | -5% | 0.1 |
The next Cabot ETF Strategist issue will be published on June 14, 2022.
About the Analyst
Kate Stalter
A Series 65-licensed asset manager, with more than two decades of experience in various areas of financial services. As an investment advisor and financial planner, Kate personally manages client portfolios, with a focus on successful retirement, including asset allocation, income generation and tax strategies.
Kate also serves as a capital-markets contributor at Forbes.com, and is an expert columnist for the investment advisory channel at U.S. News & World Report.
She served as trading instructor and market commentator for Investor’s Business Daily, and launched the “Small Cap Roundup” radio show and stock newsletter for Tiger Financial News Network. Kate hosted the “Daily Guru” podcast for MoneyShow, while also serving as a MoneyShow market columnist and video host.
She currently owns registered investment advisory firm ProsperitySource Advisors, which focuses on broad allocation strategies, incorporating global equity and fixed-income asset classes and all market capitalizations.


