With Friday’s action in the broad market undercutting the prior May 12 low, we have a clear signal that the uncertainty is continuing. That’s despite the S&P 500 and the Nasdaq rallying to end the session above their earlier lows.
As I noted in aCabot Wealth Daily article last week, we’re at a unique juncture in the investment markets. Friday’s action underscores that point.
As I wrote, history may not exactly repeat, but it often rhymes. In the market, that means technical, fundamental or economic conditions that may resemble some from the past. This is one of the tenets of technical chart analysis: By studying and recognizing signals that preceded market moves, you can potentially identify key pivot points on a contemporary chart.
That’s the approach I’ll continue to take, although it’s important to have an understanding of the story, or broader conditions that may be driving price action.
For example, the spike in inflation, rising interest rates, a stagnating economy and a vulnerable stock market look pretty similar to nearly 50 years ago, in 1973. If this continues along the same trajectory, we’re looking at years of steadily rising rates that render bonds useless as investments. It could also result in five to 10 years of near-zero net returns in the stock market.
Sure, that’s a worst-case scenario, but how should you approach this situation?
If the markets slip further down, you need to do more than hide in cash. That’s an outdated approach that goes back to an era when investors weren’t trading options as they are today, and didn’t have vehicles such as inverse ETFs, or even narrowly targeted ETFs that track a specific industry within a sector, or an even more targeted investment theme.
That’s the thought process behind the Undiscovered Portfolio, which is tailored toward capturing gains in whatever type of market we’re experiencing.
It also entails rethinking some assumptions about successful investing.
For example, we’ve become accustomed to outperformance of growth, relative to value. It’s not that value has been a dud; it’s just that growth outpaced value for the past 15 years.
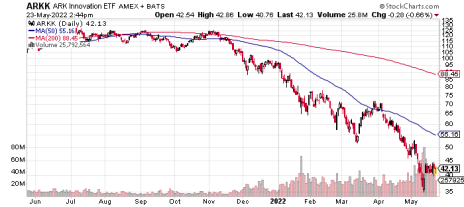
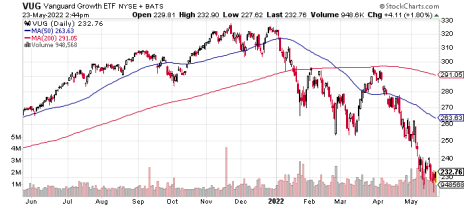
But that situation appears to be shifting. A relevant example is the ARK Innovation ETF (ARKK), which has dropped more than 70% in 15 months. While innovative companies are typically among the ranks of top-performing growth names, ARKK’s actively managed strategy is lagging the Vanguard Growth ETF (VUG), which simply tracks an index of large-cap domestic growth stocks.
You can see that relative performance in the two charts below.
All that is to say, don’t assume that what’s worked in the markets in the past several years will continue to work in the foreseeable future. It’s imperative that investors remain flexible and stay prepared to take some steps beyond the old-fashioned advice to stampede into cash in a downturn. If one asset class is underperforming, something else is picking up the slack.

