Many, many, years ago I came across an incredible infographic on the performance of the stock market.
Every and I mean EVERY, investor should take a look at this infographic before investing another dollar. Because once you do, you’ll immediately begin to change your investment outlook. But, more importantly, how you will invest going forward.
“In Investing, It’s When You Start and When You Finish”
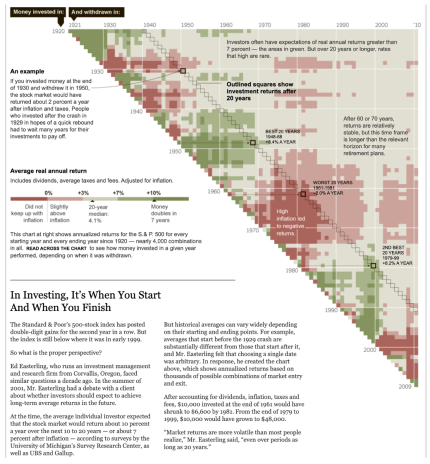
Ed Easterling, founder and president of Crestmont Research, published an eye-opening infographic that has changed the way informed investors approach the market, forever.
Source: Crestmont Research: The New York Times
What Mr. Easterling’s data displays is simple, the buy and hold strategy that most investors are accustomed to following has major holes. Holding securities for the long haul isn’t a guarantee of profitable results. Results depend on “when you start and when you finish.”
The example stated in The New York Times article states, “after accounting for dividends, inflation, taxes and fees, $10,000 invested at the end of 1961 would have shrunk to $6,600 by 1981. From the end of 1979 to 1999, $10,000 would have grown to $48,000.”
I know, it’s a fairly simplistic table, but don’t let that hide the fact that it’s incredibly powerful.
Basically, markets are unpredictable. And results, with the traditional buy and hold approach, are completely dependent on timing. Extreme volatility is normal and should be expected even over time frames as long as 20 years. Remember, we don’t have a crystal ball, no one can predict future market results. But we certainly don’t have to sit on the sidelines and hope for the best. We have the ability to take our fate into our own hands by using intelligent, statistically based strategies that offer defined risk, regardless of market direction.
Now I’m not here to trash a buy and hold strategy. There are legitimate reasons to use a dollar cost averaging, buy and hold approach.
But I also understand that investors now have access to investment strategies that were once only available to professionals. Strategies that allow us to make money in any type of market: bullish, bearish or neutral. Strategies that are based purely on statistics, probabilities, and a mathematical advantage.
The barrier to entry is practically nonexistent at this point. Low commissions and powerful trading platforms allow everyone access to a level playing field.
What we need to realize is that investing isn’t all about buying and holding and simply hoping for the best. Investing is about eliminating volatility, smoothing out your equity curve while allowing yourself to make a consistent return regardless of market direction.
This is why I use options.
Options allow me to make money in any type of market, while defining my overall risk. Better yet, as a person who values statistics over hunches or a crystal ball approach, I am able to choose my own probability of success on each and every trade I place. So, even if I’m wrong about my directional assumption I am still able to make a return.
This is why you are here. You are interested in doing the same.
In this report, I’m going to go over the foundational elements that make up my statistical approach to options trading. As always, if you have any questions as you progress through the report, please do not hesitate to email me.
The One Statistical Law All Successful Traders Follow
The foundation of all quantitative or statistically based options traders rests on one statistical law—The Law of Large Numbers.
The Law of Large Numbers states that as you increase your sample size, in our case number of trades, our expected value or probability of success will come to fruition.
This is because the Central Limit Theorem shows us that actual values will converge on expected values.
But, in order for the Central Limit Theorem to work, we need a large enough sample size or number of observations—in our case, trades. This is where the Law of Large Numbers comes in.
I’m certain many of you, during elementary, middle or high school, went through the following math exercise.
Coin Toss Example
A coin has a 50% chance, or probability, of landing on heads or tails.
Therefore, according to the Law of Large Numbers, the number of heads in a large number of coin flips should be 50%, which is known as our expected value. Basically, as our number of trades increase over time the expected win ratio, in this case 50% (heads or tails), should fall increasingly closer to the expected value—again, 50%.
But we must understand that when we follow a quantitative approach there are several obstacles that we must acknowledge on our journey to accomplishing the inevitable expected value.
Variance Is a Factor
When flipping a coin 10 times, the variance of the coin landing on heads has an average range of three heads to seven heads. As we increase the number of observations the range tightens until eventually the overall probability of success stands at approximately 50%.
But, early on, due to variance we will experience bouts of sequencing risk.
Basically, just because our expected value is 50% it doesn’t mean that for every 10 flips we are going to fall right at 50%, or five heads and five tails. In the world of quantitative trading, we call this sequencing risk. Sequencing risk simply means that we could have numbers that vary from zero heads to 10 heads for every 10 flips. We call these statistical outliers, and they should be expected from time to time.
But again, the Law of Large Numbers always falls around the expected outcome as the number of observations (trades) increase. Again, in our coin toss example that is 50%.
Maximizing the Number of Trade Occurrences is Essential to Long-Term Success
- If you flip the coin 10 times, 7 heads and 3 tails may occur (70% heads / 30% tails)
- If you flip the coin 100 times, 60 heads and 40 tails may occur (60% heads / 30% tails)
- If you flip the coin 500 times, 275 heads and 225 tails may occur (55% heads / 45% tails)
- If you flip the coin 1,000 times, ~500 heads and ~500 tails may occur (~50% heads / ~50% tails)
It’s an incredibly easy concept to understand, yet, most statistically based traders simply don’t allow the Law of Large Numbers to work in their favor. Lack of patience is typically the reason.
My Approach to Options Trading
The Law of Large Numbers is important to understand because unlike a coin flip that has a 50% probability of success, my approach has a probability of success that is significantly higher, roughly 70% to 85%.
As a result, my expected outcome, or win ratio, is going to be 70% to 85%.
This is why professional options traders trade for a long, long time, well after retirement. Stock traders, not so much. Why? Well, again, it comes down to probabilities and when your probabilities are at best roughly 50% ... the Law of Large Numbers will eventually catch up to you.
We want the Law of Large Numbers to catch up to our strategies. We want to see our expected probability of success of 70% to 85% come to fruition. Because if we know what our expected outcome is going to be over the long term, we know ahead of time how to manage our risk, and managing risk is THE MOST IMPORTANT ASPECT of investing or trading.
A Quick Example Using a Risk-Defined Options Strategy
Depending on my service, I place weekly and/or monthly trades only using highly liquid major market and sector ETFs like SPY, QQQ, DIA, IWM along with a host of the stocks with highly-liquid options that reside in those same major market and sector ETFs.
The following is an example of how I might approach one of the high-probability trading, risk-defined, strategies I use.
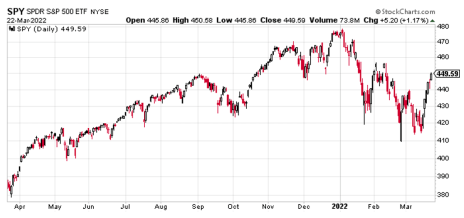
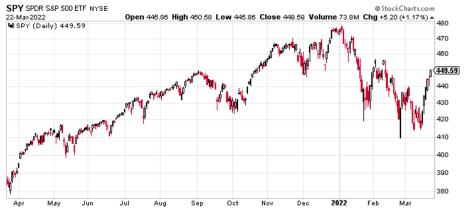
As you can see in the chart below the SPDR S&P 500 ETF (SPY) is trading for 449.59.
Let’s say I am currently short-term bearish to neutral on the S&P 500.
As a result, I am going to use a strategy known as a bear call or short vertical call spread. You can read about the strategy, in great detail, in my associate bear call strategy report.
A bear call spread is a risk-defined credit spread strategy that consists of a long and short call, at different strikes within the same expiration cycle.
When using a bear call spread, like all the strategies I use, you have the ability to choose your own probability of success on the trade. My preference is to use a probability of success within the 70% to 85% range, leaning towards the latter.
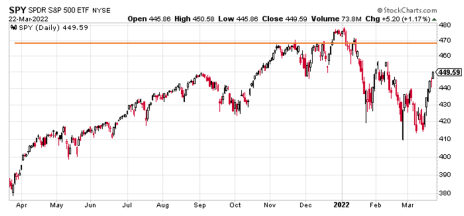
For example, with SPY trading for 449.59, we can simultaneously sell a call at the 469 strike and buy a call, thereby defining our risk, at the 474 strike.
By selling the April 29, 2022, 469/474 bear call spread we are able to bring in roughly $0.95, for a potential return of 23.4% over the next 38 days. To calculate the credit received, take the mid-price of the 469 strike ($2.37) and subtract the ask price of the 474 strike ($1.42). As always, you may have to alter your price slightly to execute the trade.
The probability of success on the trade is 81.62%.
Basically, as long as the SPY remains below our short strike at expiration, or 469 (as seen in the orange bar below), we will collect the entire 23.4%. So our margin of error on the trade is just under $20 (short strike of 469 minus the current price of SPY, or 449.59).
In short, knowing we have a probability of success greater than 80% on the trade, our win ratio, as our number of trades increases, should fall around 80%. That’s right, 80%!
Of course, as I stated before, much of your success relies on how disciplined you are as a risk manager, achieved through consistent and strict position-size guidelines. I will cover how I approach risk management throughout my various strategy reports.
An Essential Tool When Using Options Selling Strategies
I use a wide variety of tools when trading options. But there are only a few that I use with each and every trade I place.
One of those tools is the Expected Move, also known as the Expected Range.
As a quantitative trader who uses predominantly options selling strategies with a high probability of success, knowing the expected move of a stock or ETF prior to making a trade is integral to my overall success.
What is the Expected Move?
The expected move is the amount a stock or ETF is predicted to advance or decline from its current share price, based on the security’s current level of implied volatility and days to expiration. Additionally, the expected move fluctuates, in real time, based on changes in a security’s price and its implied volatility.
Simply stated, the expected move shows us the future expected range of a security over a specific time frame.
Let’s take a look at a quick example.
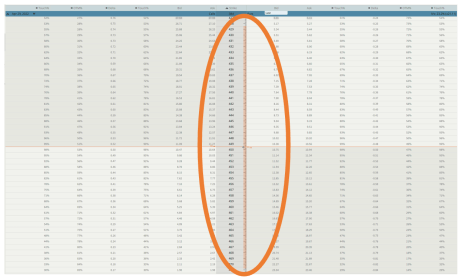
Below is an image of the SPDR S&P 500 (SPY) ETF. More specifically, we are looking at the options chain for the April 29, 2022, expiration cycle that has 38 days left until expiration.
The vertical, tan-colored bar represents the expected move for the expiration cycle. The current range is between 428 to just over 470. The market is essentially telling us that it expects SPY to close somewhere between 428 and 470 at expiration on April 29, 2022. Having this information prior to placing a trade is incredibly invaluable.
How I Use the Expected Move?
Okay, so knowing the expected move is between 428 and 470, I can place a trade outside of the range.
Bullish Approach
If I’m bullish and using a risk-defined trade, I can use a bull put spread, otherwise known as a short put vertical spread. My preference, in most cases, is to place the spread outside of the expected range, in this case below the 428 put strike.
Oftentimes, I like to go well outside the expected range, thereby increasing my probability of success, or probability of profit. As you can see from the image above, by choosing the short put strike of 417, my probability of success on the trade is 80.19%. Of course, I could increase my potential probability by significantly more if I so choose.
For instance, if I chose the 413 put strike as my short strike, my probability of success increases to 82.40%. The only tradeoff is the greater the probability of success on the trade, the lower my overall premium at the time of the trade.
Bearish Approach
If I’m bearish and using a risk-defined trade, I can use a bear call spread, otherwise known as a short call vertical spread. My preference, in most cases, is to place the spread outside of range, in this case below the 469 put strike.
Again, my preference is to go outside the expected move, thereby increasing my probability of success. As you can see from the image above, by choosing the short call strike of 469 my probability of success on the trade is 81.71%. Of course, I always have the choice of increasing my probability of success.
For instance, if I chose the 472 strike as my short call strike, my probability of success increases to 85.46%. The only tradeoff, as I increase the probability of success on the trade, my premium, or potential profit, declines.
The expected move is just one of many important tools I use as a professional options trader. I reference the expected move for every trade I place, and I suggest you get in the habit of doing so as well. Always, always, always understand what your probabilities are throughout the life cycle of each trade you place. Whether you are initiating a trade or managing the risk of your open position, knowing the expected move is an essential tool to your long-term trading success.
In Summary
Understanding that investing is a coin flip is the first key to understanding that we must diversify our approach to the market. Easterling points this clearly points this out in his “In Investing, It’s When You Start and When You Finish” research.
But we now, as self-directed investors, have the ability to combat uncertainties by using other statistical approaches, strategies that were once only privy to institutions, hedge-funds and the like.
My hope through reading this report is that you start to get an initial glimpse into how I approach trading options, using a high-probability approach.
Please take the time to read all of my strategy reports as I will use each and everyone of them listed. This will certainly give you a greater sense of my approach and how we will proceed going forward.
As always, if you have any questions please feel to email me at Andy@CabotWealth.com
