Trader’s Toolbox: High-Probability Mean Reversion Indicator (Heading into the Week of August 30)
Let’s get this straight from the onset: There is no holy grail when it comes to indicators. You are not going to find an indicator that is completely foolproof. It doesn’t exist.
However, there are certainly helpful indicators out there to assist you in your trading endeavors. But the indicators you choose truly depend on the strategy you use. And fortunately, for those that use high-probability trading strategies, the high-probability mean reversion indicator can be incredibly useful for trade entry and exit signals.
Some may average together various RSI readings, like the 2-day, 3-day and 5-day, but that makes absolutely no sense. We look at various levels of overbought and oversold over different time frames and use these readings, again, as a way to help decide when to enter and exit a trade.
[text_ad use_post='261460']
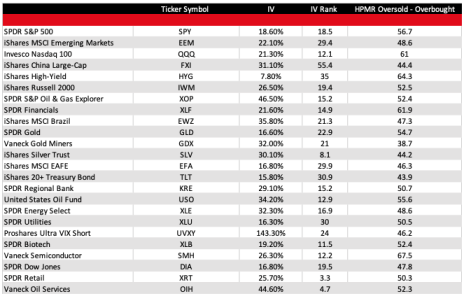
I like to use three different RSI readings, the 2-day, 5-day and the standard 14-day. Each timeframe gives me a different idea as to how a security has performed over the short, intermediate and long term.
Once I have this information and see that an extreme is hit, I can then apply a high-probability options strategy around the extreme reading. I like to use various credit spreads like bear calls spreads, bull put spreads, iron condors and several others. The reason I like to use these strategies is because they give me even more room for error just in case the security I’m trading continues to trend in one direction.
Here are the various levels I use to determine if an ETF is in an oversold or overbought state.
- Very Overbought – an RSI reading greater than or equal to 90.0
- Overbought – greater than or equal to 80.0
- Neutral – between 20.0 and 80.0
- Oversold – less than or equal to 20.0
- Very Oversold – less than or equal to 10.0
High-Probability Mean Reversion Indicator (Heading into the week of August 30)
So, what exactly is high-probability trading?
And why is it so appealing to mathematically inclined traders?
Well, the foundation of high-probability trading is based on two simple laws of statistics; the law of large numbers and the law of probability. It’s that simple.
Of course, trading around these statistical truths takes a bit more knowledge and skill, but the foundation is clear. And as always, you must have a disciplined risk-management plan in place, which I will begin to discuss in greater detail over the next several weeks.
High-probability mean reversion trading takes some patience, but as I said before the rewards can be great over the long term. Take a security that is already extended and wrap a high-probability options strategy around it and you have a winning formula for success. The law of large numbers and the law of probability allow it. Sounds easy, but there are a few other key factors (sequence risk, risk management, position size, adjustments) that you must understand before you go full throttle.
I’ll be discussing all of these elements in upcoming articles and a few upcoming videos that I’m excited about. As always, if you have any questions, please feel free to email me or post your question in the comments section below.

