We start this month with our Spotlight Stock, a company that operates in the Oil Services area. Beaten down by low oil prices, this company is pulling out all the stops to cut costs and expand into new geographical arenas—efforts that are attracting some very interesting institutional interest in its stock. My Feature article further explores the strategies that the company and its new management team are applying to manage—and expand—the company’s footprint.
Wall Street’s Best Investments 796
[premium_html_toc post_id="137476"]
Market Views
Long-Term Remains Positive
In the immediate-term (1-3 week), the stock market remains unsettled as evidenced by the preponderance of NYSE stocks making new 52-week lows. On Aug. 12, for instance, there were 158 stocks on the new 52-week lows list while only 17 made new highs. Obviously the hi-lo polarity must return to a positive number before the next immediate-term bottom is confirmed. As long as this negative polarity persists the market remains vulnerable to selling pressure.
The dominant longer-term trend remains positive, however. In the final analysis, the weight of evidence still favors the stock market’s primary trend remaining up as long as it’s supported by the technical, fundamental, and investor sentiment indicators. It would therefore be premature to jump to a negative conclusion on the bull’s long-term health.
Cliff Droke, Momentum Strategies Report, www.cliffdroke.com, 707-282-5594, August 15, 2017
Looking to Move Higher
There were 1966 net declines for last week and we did a short study to see what predictive powers this statistic has. We went back to December 12, 2014 and looked at each week with over 1500 net declines. We then looked to see where the S&P 500 was two weeks later.
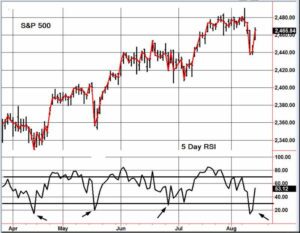
There were 12 instances. In 8 of those, the S&P was higher after two weeks for a net gain of 422 S&P points through last Friday. It would appear from this and other indicators, that the odds favor more upside over the next couple of weeks. The S&P 500 has curled up from an oversold 5 Day RSI (right arrow). When this happens, we typically move higher over the next several days and weeks.
Stephen Todd, Todd Market Forecast, www.toddmarketforecast.com, 909-338-8354, August 14, 2017
Investors May Be Too Bullish
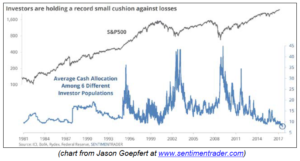
Investors have record low levels of cash allocations in their investment portfolios, meaning that they are excessively bullish, and as a contrarian I see that as a danger sign. Admittedly, low cash allocations won’t tell you exactly when to sell, but as you can see from this chart, good times to buy are when investors have very high cash allocations and are very fearful, whereas good times to sell are when cash allocations are very low.
Rex S. Takasugi, Technical Disciplines, P.O. Box 6029, Kent, WA 98064-6029, 253-639-0436
To read the rest of this month’s issue, download the PDF.
THE NEXT Wall Street’s Best Investments WILL BE PUBLISHED September 20, 2017
Neither Cabot Wealth Network nor our employees are compensated by the companies we recommend. Sources of information are believed to be reliable, but are in no way guaranteed to be complete or without error. Recommendations, opinions or suggestions are given with the understanding that subscribers acting on the information assume all risks. © Cabot Wealth Network. Copying and/or electronic transmission of this report is a violation of U.S. copyright law. For the protection of our subscribers, if copyright laws are violated, the subscription will be terminated. To subscribe or for information on our privacy policy, call 978-745-5532, visit www.cabotwealth.com or write to support@cabotwealth.com.

