Small caps have trailed the broad market by about 13% since last May.
On the surface that doesn’t sound so good. But dig a little deeper and you see that small-cap performance matches that of the equal weight index, as well as one of the biggest tech giants in the world.
What’s more, the case for small caps moving forward is pretty darn attractive.
[text_ad]
Small Caps and Equal Weight S&P 500 Neck & Neck
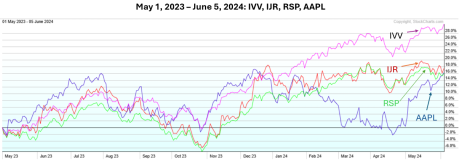
Since last May the iShares S&P 500 Equal Weight ETF (IVV), shown in pink in the chart below, is up 31%. As we all know, a lot of that performance is attributed to the mega-cap tech stocks, Microsoft (MSFT), Nvidia (NVDA), Alphabet (GOOG), etc.
But once we strip out those heavyweights and look at the equal-weight index things change. The Invesco S&P 500 ETF (RSP), shown in green, is up just 16% since last May, slightly trailing the iShares S&P 600 Small Cap ETF’s return of 17%.
Also up “just” 16%? Apple (AAPL), the world’s third most valuable publicly traded company.
In this context, small-cap stock performance doesn’t look so bad after all. Though to be fair, looking at year-to-date data, small caps (+1%) are trailing both AAPL (+2%) and the RSP (+5%)
So what could get small caps going again?
There are at least three things.
Small Caps Trade at a Discount
First, small cap valuations are extremely attractive relative to history, as well as to large caps.
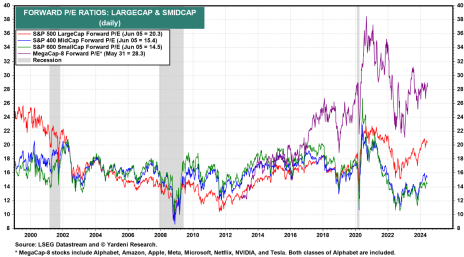
As you can see in the chart from Yardeni Research below, small caps trade with a forward price-to-earnings (PE) ratio near 14.5, considerably lower than large caps at 20.3. Granted, profit margins for small caps over the coming 12 months are expected to be around 6% versus 13% for large caps, so a discount is warranted.
However, relative to their own valuation – even in times of high interest rates – small caps are trading at a discount.
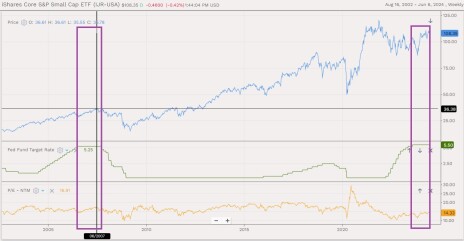
You can see this relationship between small-cap valuation and interest rates in the chart below, which has the IJR price at the top (blue line), the Federal Funds Rate (FFR) below that (green line) and the IJR’s forward PE at the bottom (orange line).
Looking at the small-cap PE you can clearly see the current small-cap valuation discount relative to history. I put purple boxes around the two times the FFR was north of 5% (now, and back in 2007). Small caps are cheaper now than they were the last time.
Obviously, there are a lot of factors influencing valuation at any given time. But in the big picture, small caps are cheap.
That might not matter today, tomorrow or next week, but it’s likely to matter a lot over the coming year or two.
Small Caps Being Held Back by High Rates
Second, and somewhat related to what we just talked about, small caps seem to want to get going but are being held back by interest rates.
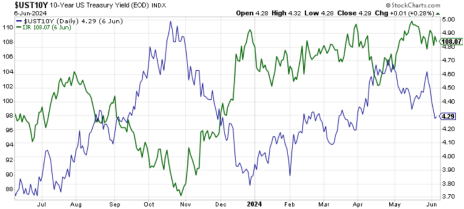
This chart shows the performance of small-cap stocks (green line) relative to the 10-year yield (blue line). As you can see, the two are often negatively correlated and have been particularly so since April.
Why?
Part of the reason is that higher rates just tend to be bad for a lot of stocks. The broad market has been negatively correlated with interest rates lately too. With hopes and expectations that the Fed will begin to cut this year, the relationship has become more intense.
But there is a significant amount of variable debt in the small-cap asset class, a lot more than in large caps. Higher interest rates mean higher interest payments mean lower profit margins and EPS. That all keeps a lid on share price performance.
It’s not complicated.
With the FFR where it is now, there isn’t a good way to refinance debt. But when rates come down, there will be. This is a big part of why rate cuts would be a nice tailwind for small caps, assuming the economy isn’t melting down of course.
Seasonality Tailwind about to Kick In
Finally, there is a compelling seasonality argument to be made for small caps (and the broad market) heading into July.
Late last week, Goldman Sachs (GS) shared data showing the first 15 days of July have been the best two-week trading period of the year since 1928. The S&P 500 Index has been positive in July for nine straight years (average return 3.6%) and the Nasdaq has been positive in July for 16 straight years.
I wanted to double-check this and see where small caps fit in the mix. So I pulled the last 20 years of data.
Goldman’s figures check out.
While small caps haven’t been as good as the broad market or the Nasdaq in July, the data clearly shows they do well in the month, up in seven of the last eight instances for an average gain of 3.5%.
Also somewhat fascinating is that small caps have been up in 13 of the last Novembers, with an average gain of 4.3%.
And small caps have been up in November in each of the last five election years, with an average gain of 3.9%.
The bottom line is that, while small caps have lagged the broad market, they’re right in the mix when we look at the equal-weight market. And it won’t take much to get the asset class moving in the right direction, possibly soon.
Where to Find the Best Small-Cap Stocks
You can learn more about what I’m recommending for small-cap stocks, including a recent recommendation with revolutionary life-saving technologies, by grabbing a subscription to Cabot Small-Cap Confidential today.
[author_ad]


